An employee satisfaction survey is supposed to be a window into how your people are really feeling at work. For years, we’ve treated it as a simple feedback form—a way to gauge the health of our company culture and maybe find a few areas to tweak, like leadership communication or work-life balance.
But let's be honest. That's not enough anymore.
From Feedback Forms to Business Intelligence
For too long, the annual satisfaction survey has been an HR checkbox. It’s a task companies feel obligated to complete, resulting in a report that collects digital dust in a shared drive somewhere. The problem is that traditional HR survey tools operate in a vacuum, giving you isolated data points without the story behind them.
This siloed approach misses the most critical connection: how your team's morale directly impacts business performance.
Knowing that 30% of your engineering team feels disconnected is interesting. But understanding how that disconnection correlates with a 15% increase in product development delays? That's a game-changer. This is the leap from basic feedback to actual business intelligence.
The Shift to Actionable Insights
Modern business intelligence tools like Wurkn completely reframe the purpose of an employee satisfaction survey. The goal isn't just to measure happiness; it's to connect the dots between how people feel and how the business performs. This means linking qualitative sentiment data directly to hard business metrics.
Imagine your quarterly customer satisfaction (CSAT) scores have dipped. A standard survey might tell you morale is low in your customer support department. A business intelligence platform like Wurkn, however, can visualize the direct relationship between low scores on "access to resources" questions from your support team and that drop in CSAT.
Suddenly, you have a clear, actionable problem to solve. It’s not about "improving morale"—it's about getting your team the resources they need to succeed.
The real value of an employee survey isn't in the scores themselves, but in the business questions they help you answer. It moves the conversation from 'Are people happy?' to 'How is our culture affecting our ability to win?'
This shift is crucial. We're moving away from treating surveys as a standalone HR task and seeing them for what they are: a powerful source of operational data. This table breaks down the difference in thinking:
Traditional Surveys vs Business Intelligence Approach
| Feature | Traditional Survey Tool | Wurkn (Business Intelligence Platform) |
|---|---|---|
| Data Scope | Isolated sentiment scores | Integrated sentiment, performance, and operational data |
| Focus | Measures employee happiness | Connects culture to business outcomes (e.g., revenue, productivity) |
| Timing | Annual or quarterly (lagging indicator) | Continuous, real-time feedback (leading indicator) |
| Insights | "Morale is low in sales" | "Low manager support scores in sales correlate with a 10% drop in quarterly bookings" |
| Output | Static PDF report | Live, interactive dashboard |
| Actionability | Vague, high-level initiatives | Targeted, data-driven interventions |
The contrast is clear. One approach gives you a snapshot in time, while the other provides a continuous video feed of your organization's operational health.
Linking Sentiment to Outcomes
This strategic approach gives COOs and PeopleOps leaders a diagnostic tool they’ve never had before. By integrating continuous feedback with operational data, you start uncovering insights that would otherwise stay hidden.
For example, a business intelligence tool like Wurkn can help you see:
- Productivity Dips: A drop in satisfaction within your sales department might directly precede a slump in quarterly revenue.
- Innovation Roadblocks: Low scores related to psychological safety could be linked to fewer new ideas being proposed by your R&D teams.
- Turnover Risks: A decline in sentiment around career growth opportunities can be an early warning signal for key talent attrition.
This level of analysis transforms employee feedback from a lagging indicator of problems into a leading indicator of future business outcomes. You can dive deeper into how to get actionable business insights from continuous employee feedback in our detailed guide.
Learning From Large-Scale Surveys
Even major institutions are catching on. A University of California, Davis, campus survey with over 14,000 participants (UC Davis Staff Experience Survey, 2021) showed strengths in work-life balance but also flagged weaknesses in leadership communication. Instead of just publishing a report, they gave managers customized dashboards to drive targeted improvements based on team-specific data.
This proves that no matter the scale, connecting data to action is the ultimate goal. Wurkn delivers this capability continuously, providing a living dashboard of your organization's cultural health and its direct impact on the bottom line.
Designing a Survey That Delivers Real Answers
The insights you get from an employee satisfaction survey are only ever as good as the questions you ask. To get feedback that’s sharp, unbiased, and actually connected to your business goals, you have to move past the generic templates. The real objective is to build a survey that people will actually finish—one that gives you real answers, not just noise.
This means finding the right mix of question formats. While every company’s survey will look a little different, a balanced approach combining quantitative and qualitative questions will always paint the most complete picture of what your employees are feeling.
Balancing Quantitative and Qualitative Questions
Quantitative questions are the backbone of any good survey. They give you measurable, trackable data that makes it easy to spot broad trends and potential issues from a high level.
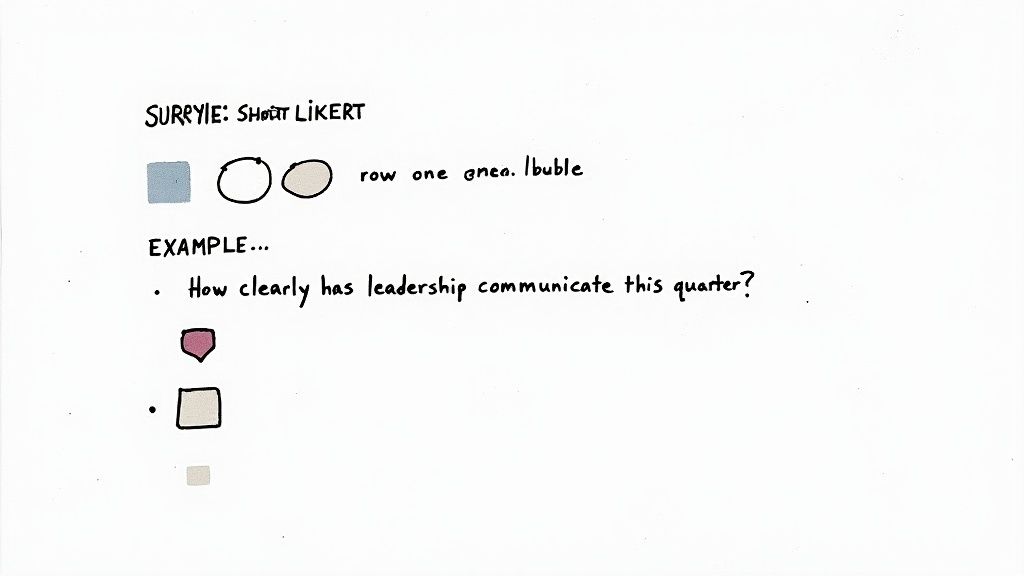
- Likert Scales: These are your classic "rate on a scale of 1 to 5" questions. They’re perfect for gauging how people feel about specific statements, like "I feel my contributions are valued by my manager."
- Multiple Choice: These are great for grabbing demographic data (like department or tenure) or specific preferences. This is crucial for segmenting your results later to find hidden patterns.
- eNPS: The Employee Net Promoter Score is a single, powerful question that acts as a barometer for employee loyalty. You can find a complete breakdown of how to use and calculate your employee net promoter score in our dedicated guide.
On the flip side, qualitative questions deliver the "why" behind those numbers. These open-ended questions give employees the space to share context, specific examples, and feelings that a rating scale just can't capture. A survey with only numbers tells you what is happening; adding open-ended questions helps you understand why.
From Vague to Actionable Survey Questions
Crafting high-impact questions is an art. The trick is to ditch vague language that leaves room for interpretation and focus instead on concrete experiences and observable behaviours. Vague questions just lead to vague, unhelpful data.
Take the tired, classic question: "Are you satisfied with communication?"
A simple "yes" or "no" tells you nothing useful. What kind of communication? From whom? About what? This needs to be broken down into a series of targeted questions that produce data you can actually do something with.
Example Comparison of Survey Questions
| Vague Question (Less Effective) | Specific Question (More Actionable) | Why It Works |
|---|---|---|
| Are you happy with your manager? | My manager provides me with constructive feedback that helps me improve my performance. | This focuses on a specific, observable managerial behaviour directly tied to employee development. |
| Is company culture good? | I feel a sense of belonging on my team. | This probes a key component of culture (inclusion) and is much easier for an employee to answer honestly. |
| Are you satisfied with communication? | How clearly has leadership communicated the company's strategic goals for this quarter? | This targets a specific type of communication (strategic goals) from a specific source (leadership) in a defined timeframe. |
These specific questions give you data you can actually use. If scores on that last question are low, you know exactly where to focus your energy: improving how leadership communicates quarterly goals.
Building Trust Through Anonymity
Even the most perfectly designed survey will fall flat if your employees don't trust the process. Fear of blowback is one of the biggest roadblocks to getting honest feedback. That’s why guaranteeing anonymity isn’t just a nice-to-have; it's the absolute foundation for collecting truthful data.
True anonymity is the bedrock of a successful employee feedback program. Without it, you’re just collecting the feedback people think you want to hear.
This is where a dedicated business intelligence tool like Wurkn has a serious edge over simple HR survey tools. Wurkn is built with privacy at its core, making sure individual responses are aggregated and never traceable back to one person. In fact, data is often only shown for groups above a certain size (like five or more people) to make it impossible to single anyone out.
Communicating these safeguards clearly and often is crucial. Before you launch any survey, make sure you:
- Explain the process: Tell your team exactly how their data will be collected, stored, and analyzed. No surprises.
- Highlight the technology: Emphasize that you're using a trusted, secure platform designed to protect their anonymity.
- Commit to action: Show them that their feedback leads to real change. This reinforces that their honest input is valued and essential for making the organization better.
Choosing the Right Cadence and Channel for Feedback
Figuring out when and how you ask for feedback is every bit as critical as the questions you ask. The classic annual survey still has its place for a deep-dive analysis, but let's be honest—it often feels more like a formal audit than an ongoing conversation. It gives you a single, static snapshot in a world that’s changing by the minute. By the time you’re ready to act on the data, the sentiment on the ground may have already completely shifted.
To get a more accurate and timely read on your organization's health, you need a far more dynamic approach. The perfect rhythm will always depend on your company’s unique culture and pace, but what we've seen work best is a multi-layered cadence. It’s all about blending different survey types to get both the 30,000-foot view and real-time, on-the-ground insights.
Finding Your Organization's Rhythm
The real goal here is to gather continuous intelligence without burning everyone out with survey fatigue. It’s a balancing act.
A solid, balanced approach usually looks something like this:
- The Annual Deep-Dive: This is your comprehensive, once-a-year baseline. It’s where you cover all the major drivers of satisfaction—from leadership and career growth to compensation and work-life balance. This is your big opportunity to gather rich, segmentable data that informs your long-term people strategy.
- Quarterly Pulse Surveys: Think of these as quick, focused check-ins. A pulse survey is perfect for drilling down into a specific area your annual survey flagged for improvement, like manager effectiveness or how well teams are collaborating across departments. They're fast to complete and let you track progress on key initiatives throughout the year.
This combination gives you a steady stream of data, which is great. But the most powerful insights? They almost always come from capturing feedback in the moments that actually matter, not just during scheduled events.
Meeting Employees Where They Work
Let’s face it: the biggest obstacle to getting high participation rates is usually just friction. Sending yet another email that gets buried in an already-crowded inbox creates an extra step for employees. A modern feedback strategy has to meet people inside their existing digital workflow, making it practically effortless to share what they're thinking.
This is where integrating a business intelligence tool like Wurkn directly into platforms like Slack or Microsoft Teams changes the game. Instead of pushing employees out to a separate platform, you pull feedback from the communication channels they’re already living in all day.
Think about the difference. You could send a formal survey link that feels like homework. Or, you could launch a quick, two-question poll directly in a team's Slack channel about a new company policy. The second one feels like part of the conversation, not a mandatory chore.
This “always-on” approach fundamentally transforms feedback from a periodic obligation into a continuous dialogue. It lets you capture real-time sentiment as it’s happening, giving you a powerful leading indicator of your cultural health, not a lagging one.
The Power of Real-Time Feedback Channels
Embedding feedback into daily tools does more than just boost participation—it completely changes the nature of the data you collect. With an always-on tool like Wurkn, you can suddenly:
- Capture immediate reactions: Launch a quick poll moments after an all-hands meeting to see how well a key strategic message actually landed.
- Diagnose issues faster: If a project milestone gets missed, you can discreetly ask the team about potential roadblocks right in their project channel, while it's still top of mind.
- Monitor change initiatives: As you roll out a new process, you can gather instant, anonymous feedback on how it’s being adopted and where the friction points are.
This kind of agility is especially critical for understanding nuanced topics like work flexibility. For example, a recent UC Irvine survey found that while 74% of workers reported being satisfied, a staggering 41% of those in hybrid or in-person roles would consider leaving for fully remote work (UCI, 2024). This just goes to show how crucial flexible arrangements are for retention right now. You can explore more findings on the shifting work landscape to see just how quickly sentiment is evolving. Capturing this sort of preference data through quick, timely polls is what helps you stay ahead of major retention risks.
By choosing the right cadence and showing up in the channels your teams already use, you build a more responsive, authentic, and ultimately far more valuable feedback loop.
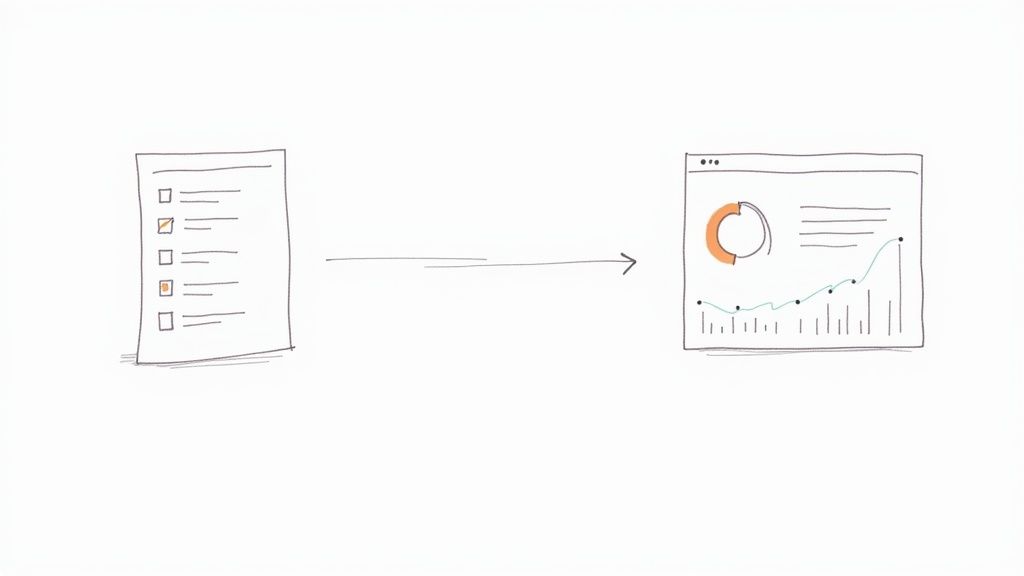
Turning Survey Data into Business Impact
Collecting survey responses is just the starting line. The real value comes when you dig into that data to uncover the story it’s telling—the story of how employee sentiment is directly shaping your business outcomes. This is where modern business intelligence tools move past what traditional HR platforms can do, translating feelings into tangible financial and operational impact.
An overall satisfaction score, say 7.8 out of 10, is a decent start, but it doesn't tell you much on its own. It’s like knowing the final score of a game without seeing any of the plays. The meaningful insights are found when you start slicing the data to uncover the hidden pain points and opportunities.
Slice the Data to Pinpoint Challenges
Segmentation is your best friend here. It’s the simple act of breaking down your survey responses by specific employee attributes, and it’s how you find the real story. This process can quickly show you that while the company-wide score looks good, certain pockets of the organization are really struggling. Think of it like a doctor using an MRI to find a specific injury instead of just hearing a patient say, “it hurts.”
Start by segmenting your data by a few key attributes:
- Department: Are the satisfaction scores in Engineering dramatically lower than in Marketing? This could point to team-specific leadership challenges, burnout, or a lack of resources.
- Tenure: You might find new hires are thrilled, while employees with 5-7 years of tenure show a sharp decline in satisfaction. That’s a massive red flag for a blocked career path.
- Location or Work Model: Comparing scores between your main headquarters, your fully remote team, and a satellite office can highlight huge gaps in culture and inclusion.
For example, a tech company might discover its sales team has the lowest satisfaction scores, even though they're the highest-paid. By segmenting further, they might see the frustration is concentrated among reps with 2-3 years of tenure. This specific insight allows them to investigate whether their mid-career training or commission structure needs a rethink—a problem they would have completely missed by looking at one blended score.
The most powerful analysis moves the conversation from a generic 'our people are frustrated' to a specific, data-backed diagnosis like 'this particular issue in this specific department is directly impacting our performance.'
Connect Sentiment to Your Business KPIs
This is where the magic happens. A business intelligence platform like Wurkn is designed to go beyond basic segmentation by visualizing the direct line between employee sentiment and hard business Key Performance Indicators (KPIs). This elevates the employee satisfaction survey from a simple HR report into a strategic asset for the entire leadership team.
Imagine a dashboard that overlays two sets of data for your operations department. One line shows a steady decline in survey scores related to "access to modern tools and resources." The other line, tracking the same period, shows a steady increase in project completion delays and budget overruns.
Suddenly, the connection is undeniable. You can now build a rock-solid business case: "Investing $50,000 in new project management software for the ops team isn't just a 'nice-to-have'; it's a direct strategy to reduce project delays that cost us over $200,000 last quarter." You can dig into a variety of work culture KPIs for enhanced business success to see how these metrics tie together.
One recent survey from Management Business Solutions (2024) highlighted some common culprits behind employee dissatisfaction, reinforcing how crucial it is to connect these feelings to operational weak points.
Key Drivers of Employee Dissatisfaction
| Factor | Influence on Satisfaction |
|---|---|
| Lack of Career Growth | 38% of dissatisfied employees cited this as their top concern. |
| Ineffective Management | Poor leadership was a primary factor for 31% of respondents. |
| Poor Work-Life Balance | 24% felt their workload was unsustainable. |
| Compensation | Only 7% listed pay as their main source of dissatisfaction. |
The data is clear: issues like career pathing and management quality aren't just "soft" problems; they are the leading indicators of future turnover and performance drops.
Use AI to Make Sense of Qualitative Feedback
Let's be honest—one of the most painful parts of survey analysis has always been sifting through hundreds, or even thousands, of open-ended comments. This qualitative data is often a goldmine of context, but the manual effort required to analyze it is enormous.
This is another area where a modern business intelligence tool like Wurkn makes a huge difference. Wurkn uses AI-powered analysis to instantly process all written feedback, identifying recurring themes, keywords, and even the emotional tone of the comments. Instead of you spending weeks reading every entry and trying to categorize them in a spreadsheet, you can get an actionable summary in minutes.
The AI can quickly spot that words like "burnout," "unrealistic deadlines," and "weekend work" are popping up constantly in comments from the product development team. It can then flag this as a high-priority theme, allowing leaders to address a critical flight risk before top talent starts handing in their notice.
This technology doesn’t replace human judgment; it supercharges it by pointing you directly to the most urgent issues buried in the text. By combining smart segmentation, KPI correlation, and AI-powered text analysis, you transform raw survey data into a clear, actionable roadmap for building a more successful and resilient organization.
Turning Insights into an Action Plan That Works
Running an employee satisfaction survey and not following up with a clear action plan is worse than not running one at all. It's a broken promise. The analysis phase tells you the "what" and the "why," but this is where you build the "how."
The most critical step is turning your findings into a credible story for leadership. This is how you get buy-in and, ultimately, drive real change. A report full of data is just noise; a plan backed by that data is a strategy.
The key is to ditch broad, generic promises in favour of targeted, data-backed initiatives. Vague commitments to "improve communication" or "focus on culture" are destined to fail. They lack specificity and, more importantly, accountability. You have to connect the dots between the feedback and a concrete, measurable solution.
From Diagnosis to Prescription
Think of your survey data as a diagnosis of your organization's health. Your action plan, then, is the prescribed treatment. And just like any effective prescription, it needs to be specific.
Let's say your data shows the marketing team feels disconnected from the company's strategic direction. The action plan isn't a vague promise for "better communication." A much more effective approach is to propose concrete actions, like:
- Launching a bi-weekly, 15-minute strategy briefing delivered by a senior leader.
- Creating a dedicated Slack channel for real-time Q&A about strategic pivots.
- Adding a "strategy alignment" metric to the marketing team's quarterly goals.
This level of detail transforms an abstract problem into a solvable one. It provides clear steps, assigns ownership, and gives everyone a tangible way to measure progress.
A survey is a question you ask your entire company. The action plan is your answer. If you don't provide a thoughtful, transparent answer, people will eventually stop asking the questions.
Securing Leadership Buy-In
Presenting your plan to leadership isn't just about showing charts; it's about telling a compelling story. This is where linking sentiment to business outcomes is a game-changer. Instead of just presenting sentiment scores, you need to show the direct correlation between employee satisfaction and core business KPIs.
For example, you can show how a 10% dip in the engineering team's satisfaction with "work-life balance" lines up perfectly with a 15% increase in project delays over the same period.
Suddenly, this isn't a "people problem" anymore—it’s a clear "business problem." That reframes the entire conversation and makes it much easier to justify the resources needed to solve it. This process transforms your raw data into a clear, actionable story that executives can understand and act upon.
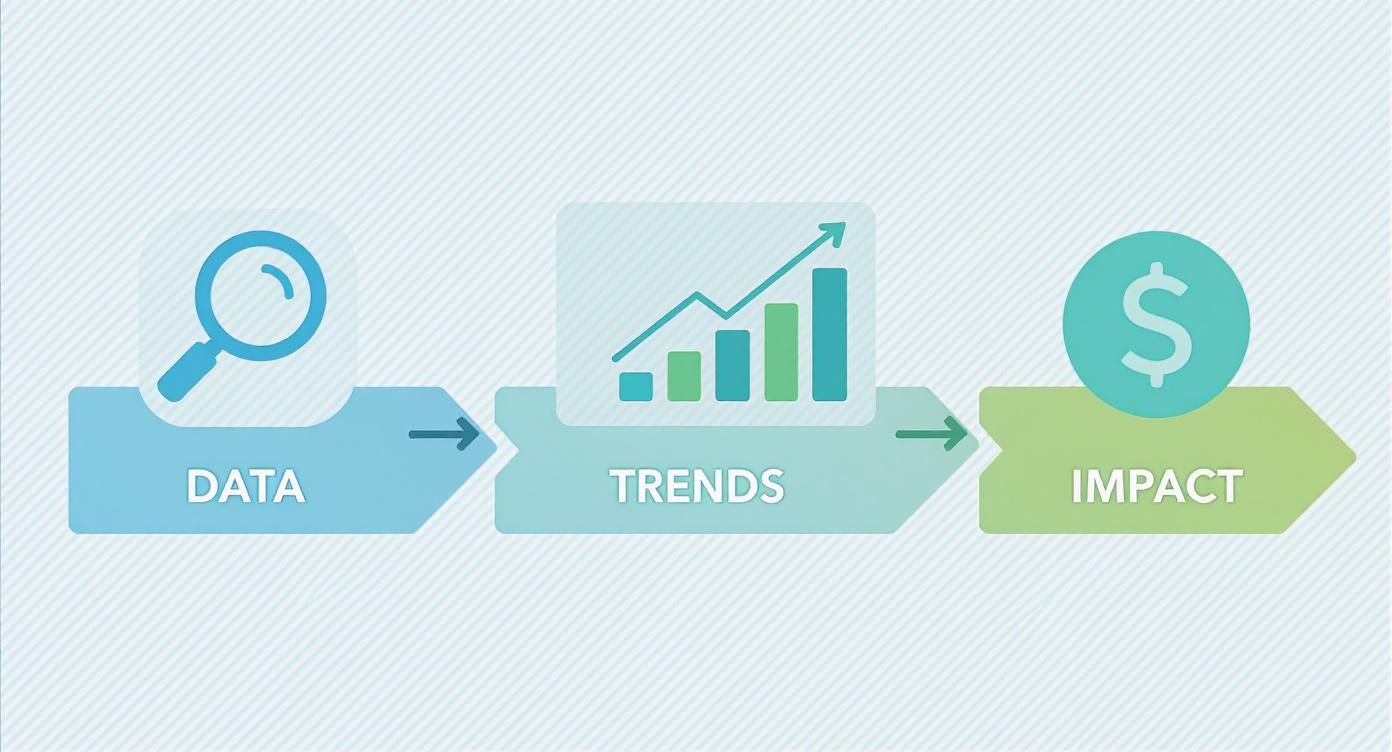
This flow is essential. You gather the data, spot the trends, and—most importantly—tie those trends to their financial impact. This final step is what elevates your employee satisfaction survey from an HR exercise to a powerful business intelligence tool like Wurkn.
Closing the Loop With Employees
Once you have a plan blessed by leadership, the final—and most crucial—step is to close the loop. Share the results with your employees, the good and the bad. Being transparent builds immense trust and shows that you genuinely value their feedback.
Present the high-level themes, acknowledge the difficult feedback, and clearly outline the specific actions you're committing to.
This isn't just about broadcasting results; it's about making employees partners in the solution. Involve them in brainstorming and implementing the changes. This collaborative approach ensures your next survey is met with enthusiasm, not cynicism, because your team has seen firsthand that their voices lead to real action. This is becoming even more critical, as regional reports show a marked decline in overall satisfaction, with the proportion of dissatisfied employees on the rise (Management Business Solutions, 2024). Read the full research about these employee satisfaction trends to see just how important this has become.
Common Questions About Employee Surveys
Even with the best strategy in place, a few common questions always pop up when you're getting an employee survey program off the ground. Getting these right is crucial for building trust and making sure the insights you gather are actually useful.
How Often Should We Run Surveys?
The right cadence really depends on the pace of your business. There’s no single magic number, so a layered approach tends to work best.
Think of it this way: a big, comprehensive annual survey is perfect for setting a deep, organisation-wide baseline. It’s your yearly health check-up. Then, you can supplement that with lighter, quarterly pulse surveys to keep a finger on the pulse of specific initiatives or see how people are feeling after a recent change, like a re-org.
But if you want to capture what’s happening right now, nothing beats an "always-on" feedback channel. This is where a business intelligence tool like Wurkn changes the game. By integrating directly into platforms your team already uses—like Slack or Microsoft Teams—you can turn feedback from a periodic event into a constant stream of actionable intelligence.
What’s a Good Survey Response Rate?
Generally, a response rate between 50% and 60% is a solid result. If you’re hitting anything above 70%, you’re doing exceptionally well; it’s a strong signal that your employees trust the process and feel engaged.
If your rates are lagging, the first place to look is your communication. Be crystal clear about why you're running the survey and exactly how the feedback will be used to make tangible improvements. You also have to guarantee anonymity, make sure the survey is a breeze to complete on a mobile device, and give a clear timeline for sharing back the results and the actions you plan to take.
How Do We Guarantee Anonymity?
This is non-negotiable. True anonymity is the bedrock of honest feedback. If people are worried their name is attached to their answers, you'll just get polite, filtered responses that don’t tell you what you really need to know.
The most reliable way to ensure this is by using a trusted, third-party platform built for this exact purpose.
For instance, a business intelligence tool like Wurkn is designed from the ground up to protect employee privacy. It works by aggregating data and often won't even display results for small groups (say, fewer than five people) to make it impossible to single anyone out. You need to be completely transparent with your team about these technical safeguards. Explaining how their privacy is protected is key to building the confidence needed for truly candid feedback.
The single biggest mistake is inaction. Asking for feedback and then doing nothing with it is worse than not asking at all. It erodes trust and guarantees low participation in the future.
Before you even send out the link, you should have a commitment to an action plan. This proactive mindset ensures you're ready to act on what you learn, proving to your team that their voice isn't just being heard—it's actively shaping the future of the organisation.
Stop treating employee feedback like an HR task and start using it as a powerful driver of business performance. With Wurkn, you can connect cultural sentiment directly to your most important KPIs. This gives you the actionable intelligence you need to build a healthier, more productive, and more resilient organisation. Learn how Wurkn delivers business intelligence beyond the survey.