True diversity at work isn’t about hitting a demographic quota for a report. It's a powerful business advantage that you unlock when you bring a wide range of experiences, skills, and perspectives together to solve tough problems and drive real growth. It’s about moving past a simple headcount to build an environment where every voice matters—making the entire organization stronger and more resilient.
Moving Beyond Headcounts to Real Inclusion
For too long, businesses in Canada and the US have tried to measure diversity by asking one simple question: "How many?" This headcount approach, usually tracked with a static, once-a-year survey, gives you a single snapshot in time. The problem? It tells you who is in the room, but it reveals absolutely nothing about whether they feel heard, valued, or empowered to actually contribute.
Relying on this old method is like checking the oil in your car just once a year. Sure, you might catch a catastrophic failure, but you’re completely missing the slow leaks and subtle dips in performance that happen every single day. True inclusion—the engine that actually powers diversity—demands a much more dynamic and insightful approach.
The Shift to Continuous Intelligence
The sharpest leaders are ditching outdated HR survey tools. They get that understanding diversity at work means having a real-time pulse on the health of their organization. Instead of betting everything on a single, stale data point, they're gathering continuous feedback to truly understand the nuanced, day-to-day experiences of their teams.
This is where a business intelligence tool like Wurkn offers a massive advantage over traditional employee engagement platforms. By tapping into continuous sentiment analysis, Wurkn provides a layer of business intelligence that goes beyond simple feedback, delivering qualitative insights right from the source and meeting employees where they already work.
By analyzing anonymized, always-on feedback, leaders can move from lagging indicators to leading ones. You stop reacting to last year's problems and start proactively shaping a more inclusive culture for tomorrow.
This shift allows you to finally see the why behind the numbers. A traditional survey might tell you that a specific demographic has a high turnover rate. Business intelligence, on the other hand, can pinpoint the underlying sentiment—like a lack of psychological safety or roadblocks to promotion—that’s actually pushing people out the door.
From Data Points to Strategic Action
Getting a handle on the daily employee experience is everything. It connects the dots between how people feel and how the business actually performs. For example, a retail chain in the United States could use these insights to spot patterns in communication showing that stores with more inclusive language have 10% higher customer satisfaction scores. This proactive stance is the key to building a workplace where diverse talent doesn't just show up, but truly thrives.
One of the most powerful ways to build this kind of environment is by championing employee-led initiatives. In fact, you can learn more about how to strengthen diversity with Employee Resource Groups in our detailed guide.
Ultimately, this modern, intelligence-driven approach takes diversity from a compliance checkbox and turns it into what it should be: a measurable driver of innovation, retention, and performance.
Connecting Diversity Directly to Business Performance

The business case for diversity at work isn’t built on good intentions anymore; it's forged in measurable results. Smart leaders across Canada and the US have figured out that a diverse workforce isn't just a cultural goal—it's a direct line to better financial performance, stronger market position, and real, sustainable growth.
The connection is actually pretty simple. When your teams are made up of people with different backgrounds, ways of thinking, and life experiences, they attack problems from every angle. This built-in variety is your best defence against groupthink, that dangerous tendency for similar-minded groups to fall into the same predictable, and often flawed, patterns. A truly diverse team naturally spots the blind spots and questions assumptions, leading to far more robust solutions.
Fueling Innovation and Problem Solving
Think about a Canadian software company building a new financial planning app. If everyone on the team has a similar urban, high-income background, they might completely miss the needs of users in rural communities or new immigrants navigating the banking system for the first time. A diverse team, on the other hand, is far more likely to build features that address these varied user experiences, resulting in a more successful product that serves a wider North American market.
This isn’t just a theory; the data backs it up. Companies with greater racial and ethnic diversity are a staggering 35% more likely to financially outperform their competitors, according to extensive research from McKinsey & Company. That performance boost comes from having a deeper well of creativity and a broader range of insights to throw at every single business challenge.
Translating Diversity into Quantifiable KPIs
For COOs and People Ops leaders, the real magic happens when you connect these cultural strengths to hard business numbers. A diversity initiative shouldn't live in an HR silo; it’s a strategic lever for the bottom line. The goal is to draw a straight, undeniable line from your inclusion efforts to the metrics that matter.
This connection shows up in a few key areas:
- Improved Customer Acquisition: When your workforce mirrors the diversity of your target markets in North America, they’re just better at understanding and serving those customers. This leads directly to increased market share.
- Reduced Employee Turnover Costs: Inclusive workplaces create a sense of belonging, which is one of the biggest drivers of retention. Lower turnover isn't just good for morale; it saves a fortune on recruiting, hiring, and training.
- Increased Productivity: Employees who feel psychologically safe and valued are more engaged and productive. It’s that simple. Better output, more efficient operations—it all flows from a culture of inclusion.
The most effective leaders no longer see culture as separate from performance. They understand that a healthy, inclusive culture is the engine of performance, directly influencing revenue, retention, and innovation.
The Business Intelligence Advantage
This is exactly where old-school HR tools like annual surveys completely miss the mark. A yearly engagement survey can't show you how a dip in inclusion sentiment in your engineering team last quarter is crushing its project deadlines today. It gives you a rearview mirror when you desperately need a real-time dashboard.
This is the gap a true business intelligence tool like Wurkn is built to fill. It goes way beyond simple feedback collection by connecting continuous, anonymous sentiment data directly to your operational KPIs. With Wurkn, a COO can see the direct correlation between rising inclusion scores in the sales team and their breakthrough success with a new customer demographic, proving the ROI of their DEI programs with hard data, not just assumptions.
This capability transforms culture from a fuzzy, subjective "feeling" into a quantifiable asset. By visualizing how positive sentiment in a department leads to higher productivity and lower attrition, leaders can finally prove the ROI of their diversity programs. You're no longer guessing; you're making data-driven decisions that build a better workplace and deliver undeniable business results.
How to Measure the Signals of True Inclusion
If you want a winning strategy, you have to start with the right measurements. When it comes to diversity at work, just counting heads in different demographic buckets is like trying to judge a book by its page count. It tells you nothing about the story, the characters, or how it makes you feel—the very things that make people want to stick around.
True inclusion isn’t a policy document; it’s a living, breathing part of your company culture. You find it in the small, everyday interactions that an annual survey will never see. To measure it right, you need to capture the real signals of psychological safety, belonging, and fairness that paint a picture of what it actually feels like to work for you.
Moving Beyond Annual Surveys
Traditional HR surveys are a snapshot in time, and a blurry one at that. They ask big, generic questions once a year, giving you lagging indicators that are often useless by the time you’ve analyzed them. It’s a completely reactive model—you’re only finding out about problems long after the damage is done and your best people are already out the door.
This is exactly where a business intelligence tool like Wurkn separates itself from standard employee engagement platforms. Instead of a once-a-year event, Wurkn uses continuous, anonymous feedback and sharp natural language processing to understand communication patterns as they happen. It's not just a survey tool; it's a cultural EKG, constantly monitoring the heartbeat of your organization to provide actionable business intelligence.
By capturing the authentic, unfiltered voice of your employees, you stop reacting to yesterday's crises and start proactively building a stronger, more inclusive culture for tomorrow.
Imagine Wurkn detecting that employees from an underrepresented group are consistently using language that signals a lower sense of belonging in their project channels. That data is a powerful early warning system, giving you a chance to step in and make things right before sentiment tanks and productivity plummets.
Identifying Representation Gaps
While sentiment analysis tells you about the feeling of inclusion, the first step is always to measure the facts. You need to identify and measure representation gaps, especially when you look at your leadership pipeline. This means taking a hard, data-driven look at who gets hired, who gets promoted, and who gets developed at every single level. Without this baseline, you’re just guessing.
The public sector actually provides a great model for this kind of accountability. The state of California, for instance, systematically tracks employee demographics across all its civil service jobs to pinpoint where representation is falling short.
Here's the kind of data visualization they use to see their workforce composition clearly.
This kind of analysis shows that even in a highly diverse state, certain jobs—especially those in higher-paying technical and management roles—are still disproportionately held by specific groups. Armed with this data, state departments are required to set measurable five-year goals to improve upward mobility for underrepresented employees. You can see exactly how California breaks down its workforce data and sets these goals on the CalHR website.
Turning Qualitative Signals into Actionable Intelligence
The real magic happens when you combine the hard numbers of representation with the qualitative signals of inclusion. A standard survey might tell you your eNPS score is down, but it can’t tell you why. A true business intelligence platform connects the dots.
Wurkn’s ability to analyze anonymous sentiment uncovers the specific themes and emotional drivers behind those numbers. It can show you that a dip in engagement in one department directly correlates with a rising feeling of unfairness around how projects are assigned, or a simple lack of recognition. These are the specific, actionable insights that let you fix root causes, not just chase symptoms. To dig deeper into this, check out our guide on why eNPS isn't enough to accurately measure company culture.
By integrating both demographic data and continuous sentiment analysis, leaders finally get the whole story. You can see not only where your representation gaps are, but also whether your culture is truly inclusive enough to keep and grow the diverse talent you work so hard to hire. This turns measurement from a passive reporting chore into your most strategic tool for driving real change.
Data-Driven Tactics for Improving Workplace Diversity
Moving from measurement to action is where the real work begins. Let's be honest: guesswork and generic, one-size-fits-all programs don't move the needle on diversity. Real progress comes from objective data that pinpoints the specific friction points inside your organization. It’s about being precise. It’s about being purposeful.
The most successful strategies are always evidence-based, focusing on systemic changes rather than one-off training sessions that make people feel good for a day. We need to target the core processes that shape an employee's entire journey with you—from the moment they see a job posting to the day they’re up for a leadership role. This is how you build a foundation of fairness that actually supports an inclusive culture.
Implement Structured and Unbiased Hiring
One of the most powerful levers you can pull is overhauling your hiring process. Unconscious bias loves to creep into hiring decisions, especially when interviews are unstructured and evaluations are purely subjective. A structured process levels the playing field for every single candidate.
This isn't complicated. It involves:
- Standardized Questions: Every candidate for the same role gets asked the same set of job-related questions. This makes comparisons fair and objective, not a matter of who you "clicked" with.
- Blind Resume Reviews: Strip out names, graduation years, and other identifying details from resumes. This forces evaluators to focus on what actually matters: skills and experience.
- Diverse Interview Panels: Make sure your interviewers come from different backgrounds and departments. This provides a much more rounded assessment and crushes the risk of groupthink.
Create Equitable Promotion Pathways
Getting diverse talent in the door is only half the battle. If you can't retain and advance that talent, you're just running a revolving door. A critical, and often overlooked, area to analyze is promotion velocity—how fast people are moving up the ladder. If you see disparities here, that’s a massive red flag for systemic barriers.
This is exactly what a business intelligence platform like Wurkn is built to diagnose. It goes way beyond traditional HR surveys by integrating hard performance data with career progression metrics. For instance, Wurkn can surface data revealing that women in a company's engineering department consistently receive stellar performance reviews but have a promotion velocity that is 15% slower than their male peers with similar ratings.
That’s not a vague feeling anymore; it's a measurable problem. Now you can design a targeted solution, like a formal sponsorship program or a complete review of your promotion criteria.
By analyzing promotion and performance data together, you uncover the hidden roadblocks that trap talented people in place. This transforms your diversity strategy from a reactive checkbox exercise into a proactive talent management advantage.
Uncovering Occupational Segregation
When you dig even deeper into the data, you’ll often find a pattern known as occupational segregation. This is where certain demographic groups get clustered into specific roles or departments, often with very limited paths for upward mobility. It can happen unintentionally over time, creating silos that choke off both individual growth and company-wide innovation.
This isn’t some niche academic concept; it’s a widespread issue with a measurable impact. A telling analysis by the Public Policy Institute of California (PPIC) found that while the state's workforce is incredibly diverse overall, many occupations are heavily skewed. For example, some agricultural jobs are roughly 90% Latino, while childcare roles are predominantly held by women of colour (PPIC, "California’s Workforce is Diverse, But Many Occupations Are Not," 2021). You can explore this more in the PPIC's detailed findings.
Using a business intelligence tool like Wurkn, you can run this exact kind of analysis on your own organization. It lets you visualize your internal map, highlighting where different demographic groups are concentrated. Discovering that your customer service team is highly diverse while your product management team isn’t gives you a crystal-clear, data-driven starting point.
Instead of launching another generic "diversity initiative," you can focus your resources where they’ll have the biggest impact—like targeted recruiting and internal mobility programs. This ensures your efforts to build genuine diversity at work are both efficient and truly effective.
Building Your Diversity Intelligence Dashboard
Data is one thing, but turning that raw information into a strategic command centre is where the real work begins. For COOs and People Ops leaders, a well-designed dashboard isn’t just a reporting tool—it’s the nerve centre for driving real change in how you approach diversity at work. This is the final step, where you move from abstract goals to hard, numerical accountability.
A typical HR dashboard might give you a few static demographic charts. A true business intelligence tool, however, creates something far more powerful. It pulls together multiple, complex data streams into one cohesive view, linking your representation numbers with the real-time, human signals of inclusion that give them meaning.
Designing a Dashboard That Drives Action
An effective diversity intelligence dashboard gives you a multi-layered view of your organization's health. It goes way beyond simple percentages to track the entire employee lifecycle. This lets you spot systemic problems and opportunities with surgical precision, instead of just relying on gut feelings.
A modern dashboard should tell a clear story, visualizing key metrics like:
- Representation by Level: Track demographic breakdowns from entry-level right up to the C-suite. This is the fastest way to see exactly where your leadership pipeline is breaking down.
- Promotion Velocity: Analyse the average time it takes for people in different demographic groups to get a promotion. This metric is brilliant at uncovering hidden roadblocks to career progression.
- Pay Equity Analysis: Keep a constant, automated watch on compensation data. You should be able to instantly flag and fix wage gaps across roles, levels, and demographics.
- Real-Time Inclusion Scores: Display aggregated sentiment scores pulled from anonymous, continuous feedback. This gives you a live pulse on how people are actually feeling about belonging and psychological safety.
This simple hierarchy shows how to put these data-driven tactics into practice, starting with diagnostics before moving on to interventions and measurement.
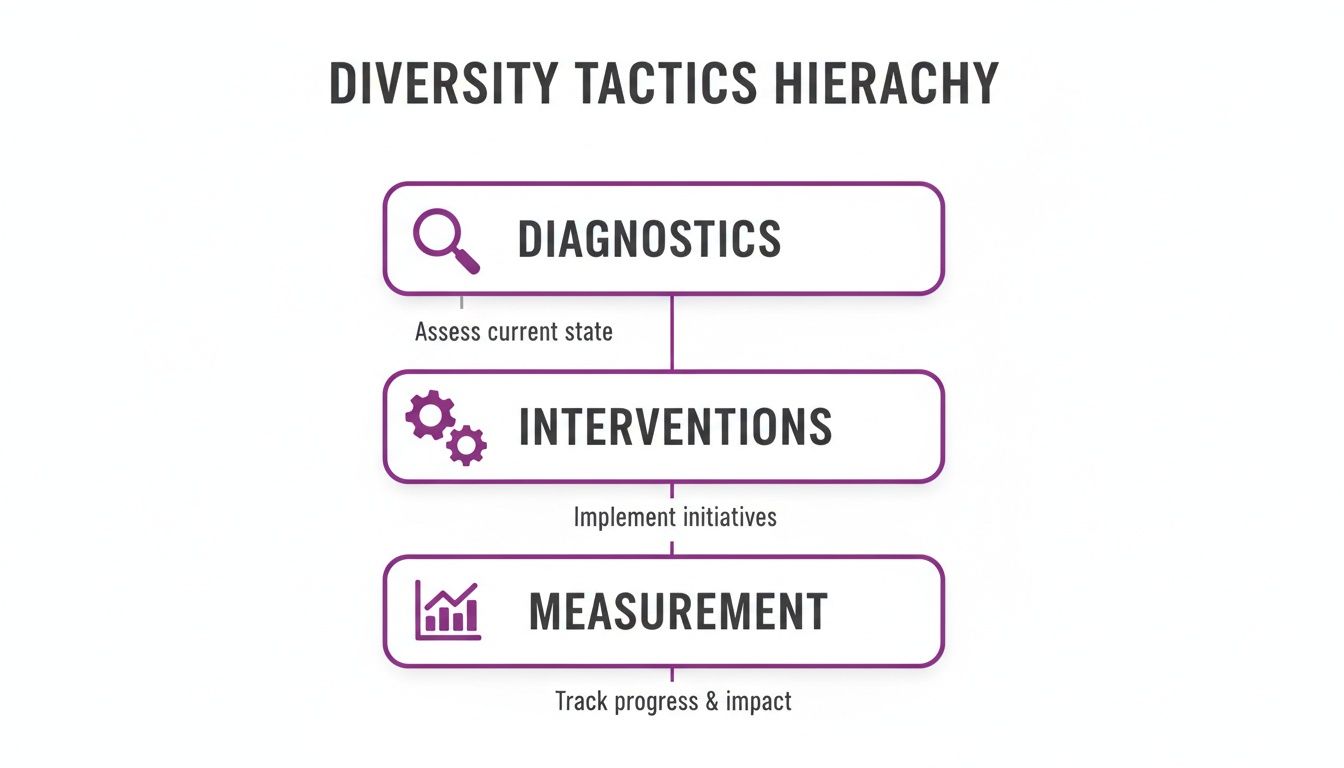
As you can see, you can't just jump to interventions. The most successful diversity initiatives follow a logical path: first, get an accurate diagnosis from your data, then design targeted fixes, and finally, measure everything consistently.
Essential Diversity Intelligence Dashboard Metrics
To get a complete picture, every COO or People Ops leader should have these key metrics at their fingertips. This table outlines a foundational set of KPIs that connects the dots between your people, processes, and performance.
| Metric Category | Key Performance Indicator (KPI) | Data Source (via Business Intelligence Tool) |
|---|---|---|
| Representation | Demographic Mix by Seniority Level | HR Information System (HRIS) |
| Hiring Funnel | Applicant & Hire Demographics by Role | Applicant Tracking System (ATS) |
| Career Progression | Promotion Rate & Velocity by Group | HRIS & Performance Management System |
| Compensation | Pay Equity & Unadjusted Wage Gaps | Payroll & HRIS |
| Inclusion & Belonging | Anonymous Sentiment & eNPS Scores | Continuous Feedback Platform |
| Retention | Voluntary Turnover Rate by Group | HRIS |
This isn't just a list of data points. It’s a framework for building a comprehensive narrative about how diversity and inclusion are functioning—or failing—within your business operations.
Connecting Metrics to Meaningful Goals
A dashboard is only as good as the goals it tracks. The most powerful approach is to link a specific intervention directly to a measurable outcome. For instance, you could have a widget tracking the percentage of employees from underrepresented groups who join a new leadership training program. You then correlate that metric directly with their promotion rates over the next 12-18 months.
A great dashboard makes accountability transparent. It empowers leaders to see the direct impact of their initiatives, celebrate measurable progress, and hold the entire organization responsible for hitting its diversity and inclusion targets.
This level of numerical accountability is no longer a "nice-to-have." For many North American companies, it's a matter of compliance. For instance, recent California laws and proposed Canadian regulations have tightened employer obligations on pay transparency and diversity reporting, requiring more detailed tracking to spot wage gaps by race, ethnicity, and gender.
By creating a central intelligence hub, you provide a single source of truth for every leader. This transparency makes accountability a shared responsibility and moves the conversation from "we should do better" to "here is exactly how we will measure our improvement." And by layering in continuous feedback, you get a much richer, more accurate picture of your team’s lived experience—far beyond what a simple survey could ever hope to provide. To see how this compares, check out our guide on the limitations of a standard employee satisfaction survey.
Your Toughest Questions About Diversity at Work, Answered
Even with solid data and the best of intentions, turning a diversity strategy into a real-world success story brings up some tough questions. We hear the same hurdles from leaders all the time, whether they're in Canada or the United States, as they try to bridge the gap between theory and day-to-day practice.
Here are some direct, no-fluff answers to the most common challenges, bringing it all back to what truly matters: measurement, business intelligence, and real, strategic impact.
How Can We Measure Inclusion if It Feels So Subjective?
This is the big one. At its core, inclusion is about a feeling—a sense of belonging and psychological safety. And while an individual's experience is personal, the ripple effect of those feelings across your entire organization is absolutely measurable.
The trick is to stop asking people how they feel once a year and start capturing objective signals of inclusion as they happen, right where the work gets done.
A traditional HR survey gives you a single, subjective data point that’s often out of date by the time you see it. A business intelligence tool like Wurkn, on the other hand, quantifies inclusion by analyzing anonymized communication data. It doesn't just collect opinions; it looks for objective patterns in aggregate data to provide predictive insights:
- Sentiment Analysis: Is the emotional tone of anonymous feedback trending positive or negative in certain teams? This isn't about feelings; it's a hard metric.
- Language Patterns: The system can identify the language of belonging versus words that suggest exclusion or a lack of psychological safety, giving you a leading indicator of cultural health.
- Participation Equity: Without ever identifying a single person, you can see if all voices are contributing equally in key discussions. Are great ideas getting buried?
This approach flips the script. It turns subjective feelings into objective, trackable data. Instead of guessing if your initiatives are making a difference, you can measure their direct impact on these signals over time and prove a clear correlation between your efforts and a healthier, higher-performing culture.
Our Company Is Too Small for a Complex Diversity Program
This is a common misconception. Many smaller businesses think a formal diversity program is just for big corporations with massive budgets. But the principles of building an inclusive, high-performing team are scalable. The goal isn’t to copy a Fortune 500 playbook; it’s to build a rock-solid, equitable foundation from day one, no matter your size.
For smaller companies in the US or Canada, the focus should be on high-impact, low-complexity actions. Start with the systems you already control.
Your hiring process is the front door to your company, so begin there. Structured interviews—where every candidate for a specific role gets asked the same job-related questions—are a simple but incredibly powerful way to level the playing field and reduce unconscious bias. Anonymized resume screening, where you strip out names and identifying details, forces everyone to focus on what matters: skills and qualifications.
Beyond hiring, use a lightweight tool to gather continuous, anonymous feedback. This isn’t about a huge budget or a dedicated team. It’s about creating one simple, trustworthy channel for people to share what’s really going on. By building these habits early, your culture of equity scales right along with your headcount, baked into your company’s DNA from the start.
How Do We Get Leadership Buy-In for Investing in Analytics Tools?
Getting budget for a new tool is always a battle, especially for something that gets mislabeled as a "soft" HR initiative. If you want to get your leadership team on board with a business intelligence platform like Wurkn, you have to speak their language: the language of business outcomes.
Don't lead with feelings; lead with finance.
Your COO, CEO, and CFO care about a very specific set of Key Performance Indicators (KPIs). Your pitch has to connect directly to those numbers. Stop talking about the importance of belonging and start showing how a platform like Wurkn provides intelligence that shores up the bottom line, moving far beyond what a simple employee engagement tool can offer.
Frame the investment not as an HR cost centre, but as a strategic tool for operations. Show them how continuous cultural intelligence is a leading indicator of business performance, giving them a predictive edge instead of forcing them to react to last quarter's bad news.
Build a business case that ties cultural analytics to cold, hard financial metrics. Use the data that's already out there to make your point:
- Turnover Costs: Pull the numbers on attrition in a critical department. Then, do the math: show them how a 10% reduction in turnover, driven by data-backed inclusion initiatives, translates directly into tens or even hundreds of thousands of dollars in savings.
- Innovation and Productivity: Connect higher inclusion scores to faster product cycles or better sales numbers. Research from firms like McKinsey consistently proves that diverse, inclusive teams outperform their peers. In fact, companies with greater ethnic diversity are 35% more likely to have financial returns above their industry medians. That’s a number no executive can ignore.
When you position a diversity intelligence tool as a direct solution to tangible business problems like retention, revenue, and risk, the conversation shifts. It’s no longer a cultural "nice-to-have"—it's a strategic necessity for winning.
Ready to transform your employee feedback into a powerful business advantage? Wurkn is the cultural business intelligence platform that connects the dots between your culture and your bottom line. Move beyond static surveys and gain the real-time, actionable insights you need to build a healthier, higher-performing organization.