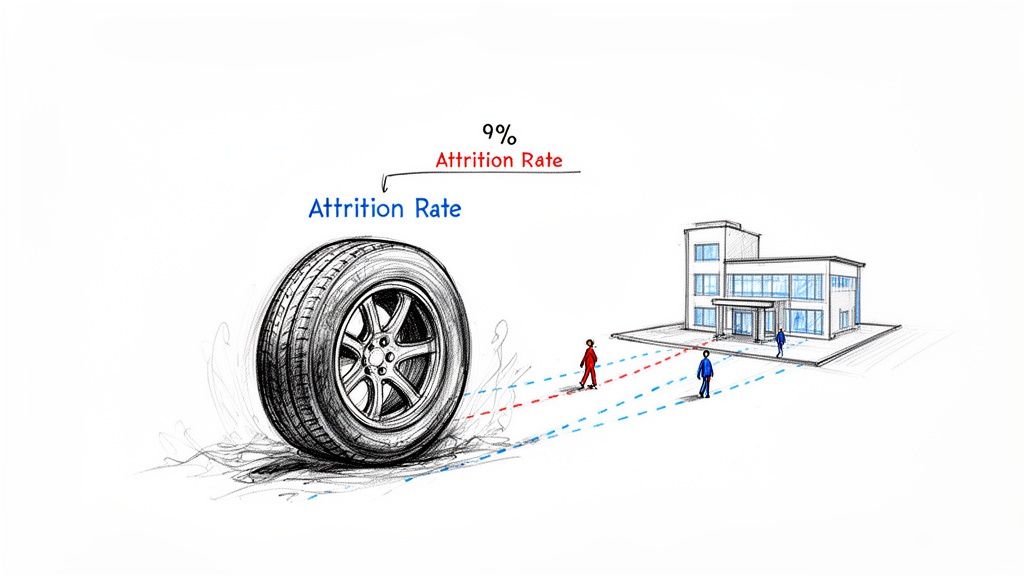
Let's get one thing straight: attrition rate isn't just another piece of HR jargon. It’s a measure of how quickly your team is shrinking because people are leaving—for any reason—and you're not hiring someone to fill their spot.
Think of it as the slow, sometimes intentional, leak in your talent pool. It’s a critical metric that helps you understand workforce reduction that has nothing to do with firings or performance-based terminations.
Defining Attrition Rate For Modern Leaders
Imagine your company is a ship on a long voyage. Attrition happens when crew members finish their contracts and get off at different ports. They might be retiring, resigning for personal reasons, or their specific role on the ship is no longer needed. The crucial detail here is that you don't immediately bring a new crew member aboard to take their place.
This gradual decrease in headcount can be a strategic choice, like planned downsizing. Or, it can be an unintentional warning sign of deeper problems brewing under the surface. For leaders in the United States and Canada, keeping a close eye on this metric is non-negotiable. It’s a core key performance indicator (KPI) that tells a story about your workforce stability, organizational health, and the real employee experience.
To get started, here's a quick overview of what you need to know.
Attrition Rate At A Glance
| Concept | What It Means | Why It Matters |
|---|---|---|
| The Core Idea | Measures employees leaving a company who are not replaced. | Reflects the natural (or unnatural) shrinking of your workforce. |
| Types of Exits | Includes retirements, resignations, and position eliminations. | It's a broader metric than just voluntary turnover. |
| The Formula | (Number of Attrited Employees / Average Number of Employees) x 100 |
Gives you a standardized percentage to track over time. |
| Strategic Goal | To understand the why behind the numbers and take proactive steps. | Helps you retain knowledge, maintain morale, and prevent operational gaps. |
This table provides the basics, but the real value comes from digging into the story your attrition rate is telling.
Why Attrition Is More Than Just a Number
Simply plugging numbers into a formula isn't enough. The best People Ops leaders and COOs know they need to understand the why behind the what. A creeping attrition rate can be the first sign of issues that your annual HR surveys are completely missing, like:
- Loss of institutional knowledge: When a veteran employee retires, decades of experience and unique insights walk right out the door with them. That knowledge is almost impossible to replace.
- Declining team morale: Watching colleagues leave one by one without being replaced can leave the remaining team members feeling anxious, overworked, and disengaged.
- Hidden operational gaps: The slow disappearance of roles can create workflow bottlenecks and strain on resources that you don't notice until something breaks.
This is where a business intelligence tool like Wurkn completely changes the game. Your basic HR platform can track the "what"—the number of people who left. But Wurkn is designed to help you diagnose the "why." By capturing continuous, anonymous sentiment from your employees right where they work, it transforms raw headcount data into actionable business intelligence.
Instead of waiting for an exit interview to find out what went wrong, you can see the early warning signs of burnout or dissatisfaction in real-time. This lets you shift from being reactive to proactive, turning your attrition data from a historical report card into a strategic tool for building a more resilient, high-performing workforce.
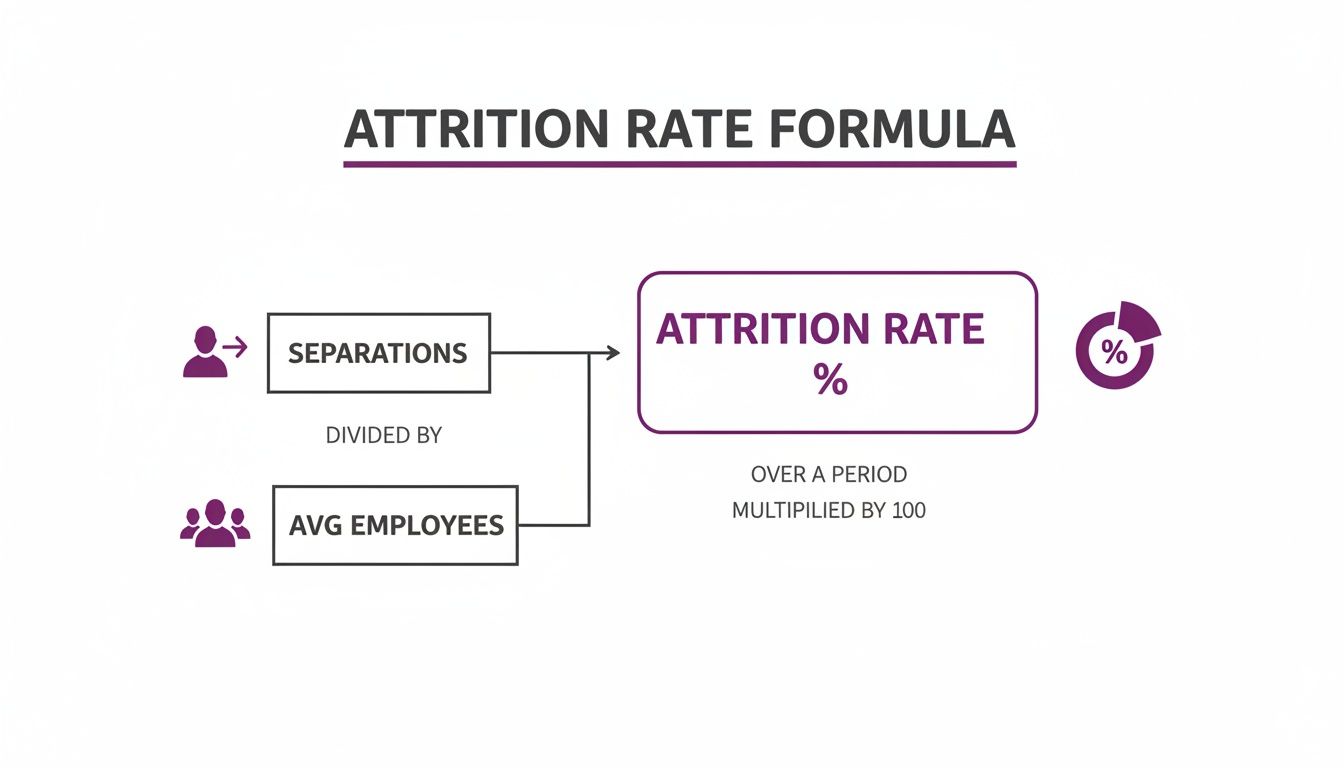
How To Calculate Your Attrition Rate
Figuring out your attrition rate can feel a bit daunting, but the actual formula is refreshingly simple. The real magic happens when you apply it consistently, turning a simple number into a clear, ongoing story about your workforce. This calculation is your first step in transforming raw headcount data into meaningful business intelligence.
The standard formula looks like this:
(Number of Separations / Average Number of Employees) x 100 = Attrition Rate %
Let's quickly break down the pieces to make sure your numbers are spot on. A "separation" is any employee who leaves the company—for any reason—whose role you do not backfill. This includes everything from voluntary resignations and retirements to position eliminations during a restructure. Think of it as a measure of your total workforce reduction.
To sidestep a common mistake, you also need the "average number of employees" for the period you're measuring. Just grabbing the headcount from the start or end of the month can throw off your results. The right way is to add your employee count at the beginning of the period to the count at the end, then simply divide by two.
Calculating Monthly Attrition
Let's walk through a real-world example for a mid-sized Canadian tech company.
Imagine you kicked off July with 150 employees. Over the month, 3 people left (one retired, two resigned), and you decided not to fill their positions. You ended July with 147 employees.
-
Find the Average Number of Employees:
(150 at the start + 147 at the end) / 2 = 148.5 -
Plug the Numbers into the Formula:
(3 Separations / 148.5 Average Employees) x 100 = 2.02%
Your monthly attrition rate for July is 2.02%.
Calculating Annual Attrition
Now, let's zoom out and apply the same logic to a full year to see the bigger picture.
Suppose that same company began the year with 150 employees. Over the next 12 months, 18 employees left and their roles were absorbed or eliminated. The company wrapped up the year with 132 employees.
-
Find the Average Number of Employees:
(150 at the start + 132 at the end) / 2 = 141 -
Plug the Numbers into the Formula:
(18 Separations / 141 Average Employees) x 100 = 12.76%
The company’s annual attrition rate lands at 12.76%.
Tracking these numbers is the baseline. And while the formula is easy, consistently pulling and plugging in the data can be a grind. To make life easier, you can use a handy attrition calculator to get fast, accurate results every time.
But a platform like Wurkn goes way beyond just the math. It dives into the cultural context behind these percentages, showing you the early warning signs of disengagement that lead to separations in the first place. It turns a simple metric into a powerful diagnostic tool, helping you understand the "why" behind the numbers so you can act before your best people decide it's time to leave.
Attrition vs. Turnover: What's the Difference?
In the boardroom, "attrition" and "turnover" are often used interchangeably. That's a mistake. While both metrics track people leaving your company, they tell completely different stories about your operational health. Confusing them means you might misdiagnose a problem and waste time and money on the wrong solution.
Let's clear this up with a simple analogy.
Turnover is like a revolving door. When one person walks out, you immediately look for another person to walk in and take their place. The goal is to keep the total number of people inside—your headcount—the same. You are actively backfilling the role.
Attrition, on the other hand, is when someone leaves, and you decide to lock the door behind them. The position is intentionally left empty, permanently reducing your headcount. This isn't an accident; it's often a strategic move tied to budget cuts, restructuring, or phasing out a specific function.
Key Strategic Differences
This distinction is mission-critical for workforce planning. High turnover is almost always a red flag. It points to underlying problems like poor management, a toxic culture, or burnout that are pushing people out. It's a costly, disruptive leak that drains institutional knowledge and team morale.
Conversely, attrition can be neutral or even a positive, deliberate strategy. It’s the result of a conscious decision to streamline the organization. However—and this is a big "however"—unplanned attrition is dangerous. That's when people leave roles you absolutely needed to fill, signalling that something is seriously wrong.
While the math is straightforward, the intent to backfill the role is what truly separates these two critical metrics.
Comparing Key HR Metrics
To make smart operational decisions, leaders need to be precise with their language and their data. This table breaks down the crucial differences between attrition, turnover, and another commonly confused term, churn.
| Metric | Primary Cause | Impact on Headcount | Strategic Focus |
|---|---|---|---|
| Attrition | Strategic choice (e.g., restructuring, automation) or natural departures (e.g., retirement). | Decreases headcount. | Workforce planning, operational efficiency, and cost reduction. |
| Turnover | Dissatisfaction (e.g., culture, management, compensation) or external opportunities. | Stays neutral (position is backfilled). | Employee retention, engagement, and identifying systemic cultural issues. |
| Churn | Mismatch in role, skills, or expectations, typically within the first year. | Stays neutral (position is backfilled). | Improving recruiting, onboarding, and early-career employee experience. |
Understanding these nuances helps you pinpoint the exact problem. Are you losing people because of a strategic pivot, a flawed culture, or a broken hiring process? Each requires a completely different response.
When the Lines Get Blurry
In the real world, things can get messy. What you initially classify as turnover (planning to rehire) might suddenly become attrition if the executive team announces a hiring freeze. An employee you expected to lose to attrition (retirement) might need to be replaced after all when a key project gets extended.
This is where traditional HR reports fall short. They give you the "what" but never the "why."
A business intelligence platform like Wurkn provides that missing context. By capturing continuous, real-time employee feedback, you can see the difference between a planned headcount reduction and a wave of resignations driven by burnout. It helps you understand if your strategic attrition is accidentally crushing the morale of your remaining top performers, giving you the insights to manage change without breaking your culture.
The Hidden Costs Of A High Attrition Rate
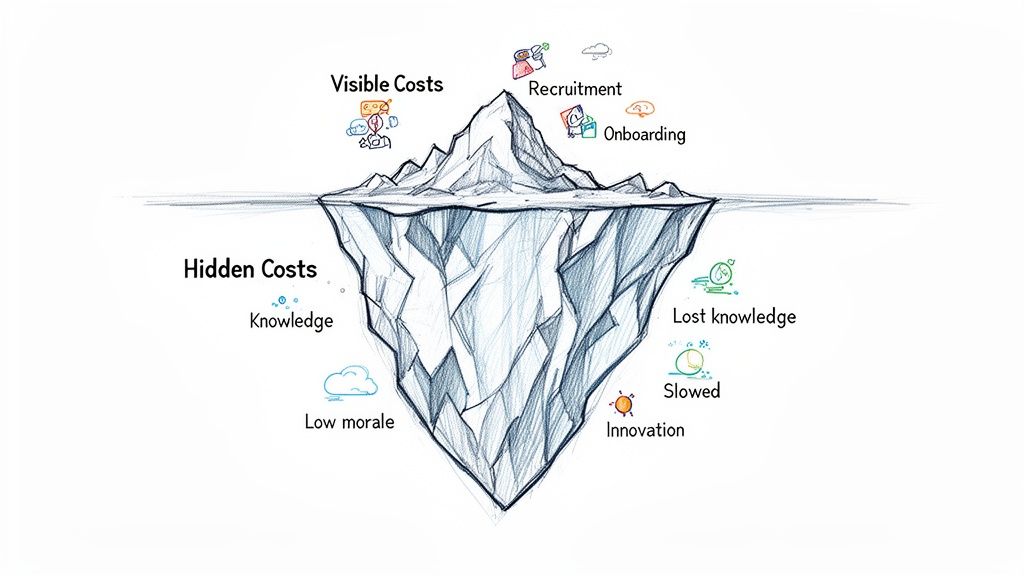
A high attrition rate is so much more than a number on an HR dashboard. It's a quiet, relentless drain on your company's energy, momentum, and financial health. Think of it like an iceberg. The costs you see—recruitment fees, advertising new roles, onboarding—are just the tip. The real damage lurks beneath the surface, where deep, hidden costs can stall your organization's progress.
This is where the true danger lies. When a seasoned employee leaves, they take a treasure trove of institutional knowledge with them. We're talking about the undocumented shortcuts, the key client relationships, and the project histories that are almost impossible to replace. The team left behind has to pick up the slack, which inevitably leads to burnout, tanking morale, and a drop in productivity that ripples across the entire department.
It's a vicious cycle. As morale dips and workloads balloon, innovation grinds to a halt. Your team becomes so focused on just keeping their heads above water that they can't think strategically or creatively. This is the unseen, long-term impact that slowly erodes your competitive edge. You can dive deeper into these expenses in our guide to the true cost of employee turnover.
A Lesson from an Unlikely Place
To really grasp how a high attrition rate flags deep systemic issues, let’s look at an unexpected parallel: medical education. In the Caribbean, some medical schools have jaw-dropping student attrition rates between 40% and 70% (Trinity School of Medicine, 2023). Compare that to the tiny 1-2% seen in U.S. institutions. The core definition of attrition rate here—students not finishing their programs—points directly to fundamental problems like shoddy support systems and overcrowded classes.
In one shocking case, a school started a term with 700 students but ended with only 450, a 36% attrition rate in just the first few years because the system was basically designed to weed people out. You can learn more about how these schools manage capacity through high attrition in this in-depth analysis of Caribbean medical schools.
Just like extreme student attrition exposes a failed academic program, a high employee attrition rate is a massive red flag for cultural or operational breakdowns inside your company.
Uncovering The Why with Business Intelligence
Traditional HR survey tools might tell you that people are leaving, but they can't diagnose the root cause in time to stop the bleeding. They’re a rearview mirror, showing you problems that have already festered for months.
This is where a business intelligence platform like Wurkn gives you a completely different advantage. It goes way beyond simple metrics by capturing continuous, anonymous employee sentiment.
Wurkn acts as a diagnostic tool, using real-time feedback to reveal the cultural cracks before they become costly chasms. It translates whispers of dissatisfaction and burnout into actionable intelligence, allowing leaders to see why people are disengaging.
Instead of just tracking who has already walked out the door, you can get ahead of the issues driving them away. By understanding the emotional tone and recurring themes in employee feedback, you can pinpoint specific areas—be it a lack of managerial support, workload imbalance, or stalled career growth—that need immediate attention. This transforms you from a reactive problem-solver into a proactive culture-builder, ready to protect your most valuable asset: your people.
Diagnosing The Real Drivers Of Attrition
Relying on an annual engagement survey to figure out why people are leaving is like trying to drive down the highway by only looking in the rearview mirror. It tells you what you've already passed, not what's coming.
By the time you get the data, slice and dice the results, and finally present a plan, the cultural damage is already done. Your best people might have already decided to leave, or worse, they've already walked out the door. In today's remote and hybrid workplaces, that time lag isn't just an inconvenience—it's a critical failure.
The subtle signs of disengagement—burnout, quiet frustration, a growing sense of misalignment—don't wait for a yearly questionnaire. They happen in real-time, in daily interactions and Slack conversations. To get ahead of attrition, you have to move faster than the problem itself.
From Static Surveys To Continuous Intelligence
This is where the idea of continuous intelligence completely changes the game. Instead of relying on a single, static snapshot of your company's health, you need a living, breathing view of what's really going on. You need to understand the why behind employee sentiment as it unfolds, not months after the fact.
This calls for a fundamental shift away from traditional HR survey tools that interrupt workflows and, let's be honest, often generate low-quality, predictable feedback. The future of workforce analytics is about meeting employees where they already work.
That's what makes a business intelligence tool like Wurkn so different. It captures always-on, anonymous feedback right inside the platforms your teams use every day, like Slack and Microsoft Teams. It’s not another survey they have to remember to fill out; it's a secure, integrated channel for employees to share unfiltered thoughts without fear of reprisal. This approach provides a constant stream of rich, qualitative data—the kind that tells a much deeper story than any multiple-choice survey ever could.
Seeing The "Why" Behind The Numbers
Of course, just collecting a firehose of feedback isn't enough. The real challenge is making sense of thousands of individual comments and turning them into clear, actionable themes. This is where Wurkn’s blend of advanced AI and human expertise gives you a serious advantage.
The platform’s intelligence pipeline analyzes all that raw, qualitative data to pinpoint recurring themes, emotional tones, and the real drivers of how your people are feeling. It doesn't just tell you what they're talking about; it explains why it matters and how they feel about it.
Instead of a generic report flagging that "communication is an issue," Wurkn can show you that engineering teams in your Canadian offices feel disconnected from leadership decisions, with a rising tone of frustration over the past three months.
This level of detail moves you from reactive fire-fighting to proactive, data-driven strategy. For instance, a high attrition rate in one region might signal deep-seated issues that go far beyond compensation. Health worker attrition in the Caribbean, for example, hovers around 8% annually. This is driven largely by nurses migrating to other countries for better pay and working conditions. This exodus worsens local shortages, leaving 30% of nursing positions vacant and showing how systemic "push factors" can erode an entire region's talent pool (Elite Medical Prep, 2023). You can learn more about this in a World Bank report analysis.
By turning continuous feedback into a living dashboard of your company's health, Wurkn lets you spot these kinds of trends early, diagnose the root causes, and step in before a small issue becomes a costly crisis.
Actionable Strategies To Reduce Attrition
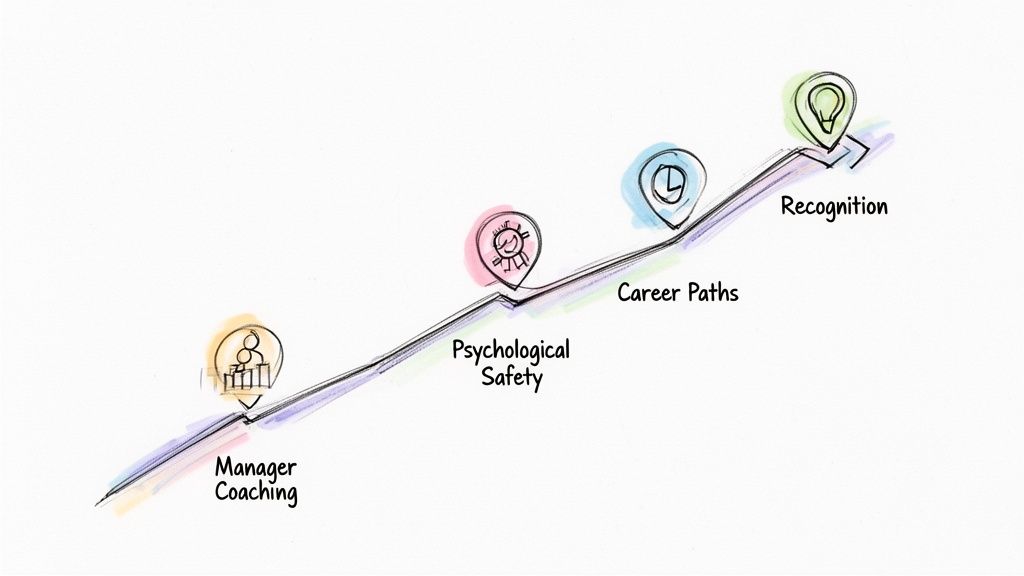
Knowing your attrition rate is the first step. Actually reducing it is where you start seeing real business impact. This goes way beyond generic advice; it requires concrete, high-impact strategies informed by the kind of real-time business intelligence you can act on.
Effective retention isn’t guesswork. It’s about listening continuously and acting decisively on what your people are telling you, often between the lines. The best approach focuses on the core elements of the employee experience—investing in the people who manage your teams and building an environment where everyone can see a future for themselves.
Invest In Manager Effectiveness
We’ve all heard it: people don't leave companies, they leave managers. It's a cliché because it's true. Managers account for the vast majority of the variance in employee engagement. A targeted coaching program can give them the skills to lead with empathy, give meaningful feedback, and genuinely support their teams' well-being.
This is where data becomes your secret weapon. A business intelligence tool like Wurkn can flag teams with plunging morale or rising frustration, signalling a need for management intervention long before it shows up in your attrition numbers. Instead of a one-size-fits-all training seminar, you can deliver tailored support exactly where it's needed most.
Create Clear Career Pathways
If your employees can’t see a path forward within your company, they’ll create one for themselves—somewhere else. Building clear, transparent career pathways is one of the most powerful retention tools you have. This isn’t just about promotions; it includes mentorship programs, skills training, and clear criteria for advancement.
Imagine a system like Wurkn highlighting a recurring theme in feedback: a lack of growth opportunities. If employees in your U.S. offices consistently mention feeling stalled, you have a precise, data-backed reason to act. This insight lets you address the root cause directly, showing your team you’re not just listening but actually responding. For more ideas, check out our guide on how to reduce employee turnover.
The link between investment and retention isn't limited to the corporate world. Look at educational dropout rates in Latin America and the Caribbean, which are effectively a student attrition rate. Countries that invest more per student see fewer dropouts. Costa Rica, for instance, invests 4,910 USD per primary student and has lower attrition. Guatemala invests just 1,353 USD and sees staggering dropout numbers (Inter-American Development Bank, 2024). You can dig into the data in this report from the Inter-American Development Bank.
Ultimately, reducing attrition starts with understanding its drivers. By moving from annual surveys to continuous intelligence, you can diagnose issues with precision and implement strategies that have a measurable impact on both your culture and your bottom line.
Answering Your Key Questions About Attrition
As a leader, you're constantly looking at the numbers. But when it comes to attrition, a few key questions always pop up. Getting straight, practical answers is the first step in turning this metric from a simple figure into a powerful tool for building a stronger, more resilient organization.
What Is a Good Attrition Rate?
This is the million-dollar question, but the honest answer is: there's no magic number. A "good" attrition rate for a tech company in downtown Toronto will look wildly different from that of a manufacturing plant in rural Ohio. Industry, specific roles, and even local economic winds all play a massive part.
Forget about chasing some arbitrary benchmark you read in a report. The real goal is to understand your own trends. A "good" rate is one that is stable or, even better, improving over time. It’s a reflection that your workforce strategy is healthy and sustainable for your specific business, not someone else's.
How Are Voluntary and Involuntary Attrition Different?
Splitting attrition into "voluntary" and "involuntary" isn't just semantics—it's essential for getting to the root cause of why people are leaving.
-
Voluntary Attrition: This is when an employee chooses to walk away, whether it's for a new job or retirement. A high rate here is a massive red flag, often pointing to deep-seated issues with company culture, burnout, ineffective management, or compensation that hasn't kept pace.
-
Involuntary Attrition: This happens when the company makes the call, usually through layoffs or performance-related terminations. A spike in this number might signal problems with your hiring process, a flaw in performance management, or a broader business strategy that isn't working.
By tracking these two types separately, you get a much clearer, more nuanced picture of your workforce dynamics. One tells you about the employee experience, while the other reflects your operational decisions.
How Often Should I Measure Attrition Rate?
For big-picture, strategic planning, looking at your attrition rate quarterly is a solid rhythm. It helps you spot meaningful trends without getting bogged down by the noise of monthly blips. For a more tactical view, a monthly calculation can give department heads the immediate feedback they need to manage their teams effectively.
But here’s the thing: by the time attrition shows up in a report, the damage is already done.
Modern business intelligence tools offer a much smarter path forward. Platforms like Wurkn give you a continuous pulse on the leading indicators of attrition—things like a dip in team morale or a quiet rise in frustration. This lets you see problems brewing and step in before you lose great people. It’s the difference between reacting to last quarter's numbers and proactively shaping next quarter's success.
Ready to move beyond static reports and get a real-time view of your company's cultural health? Discover how Wurkn transforms continuous employee sentiment into actionable intelligence that helps you reduce attrition and drive business results. Learn more about Wurkn.