Traditional employee surveys often feel like a once-a-year formality, producing data that's outdated by the time it's analysed. Leaders understand that employee feedback is critical, but these static snapshots fail to capture the dynamic, day-to-day reality of workplace culture and sentiment. The real challenge isn't just collecting opinions; it's transforming them into a continuous stream of actionable business intelligence that can predict turnover, identify productivity bottlenecks, and directly influence revenue.
This guide moves beyond basic templates to deliver a strategic playbook. We will break down eight distinct employee opinion survey example types, providing not just sample questions but a comprehensive framework for deployment, analysis, and, most importantly, decisive action. You'll learn how to connect survey results directly to crucial business key performance indicators (KPIs) like retention, productivity, and organisational performance.
We'll also demonstrate how to evolve from periodic data collection to a living cultural dashboard. This involves integrating feedback into advanced business intelligence tools like Wurkn, which translate ambient, continuous sentiment from workplace communication platforms into a real-time view of your organisation's health. This modern approach empowers COOs and People Operations leaders to connect cultural signals to core business outcomes, enabling them to make informed decisions that drive performance and build a resilient, highly engaged workforce.
1. The Foundational Benchmark: Likert Scale Employee Opinion Survey
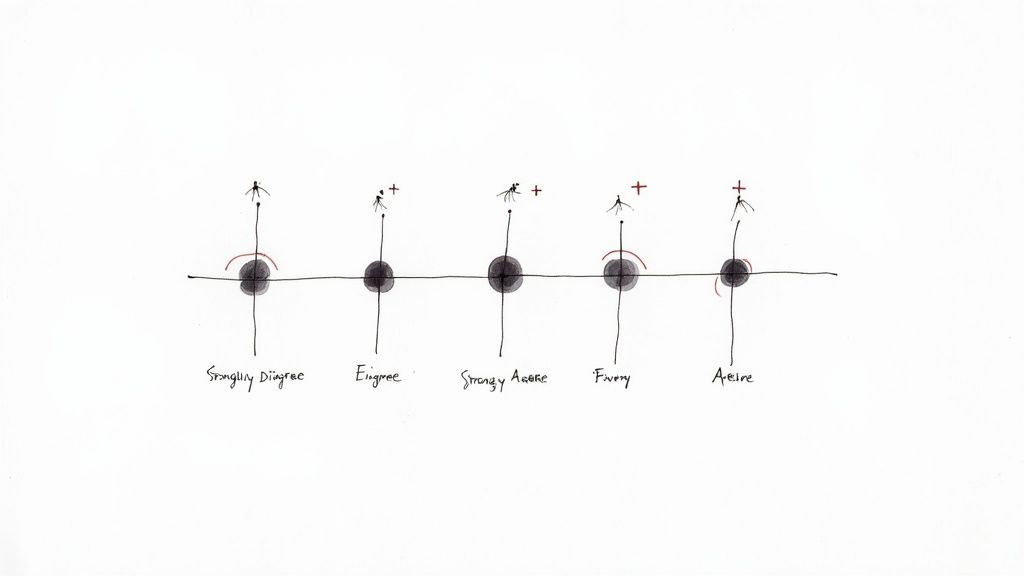
The Likert scale employee opinion survey is the quintessential tool for quantitatively measuring employee sentiment. Developed by Rensis Likert, this method asks respondents to specify their level of agreement with a series of statements, typically on a five-point scale ranging from "Strongly Disagree" to "Strongly Agree" (Likert, R., 1932, A Technique for the Measurement of Attitudes). This structure transforms qualitative feelings into measurable data, providing a reliable baseline to track organisational health over time.
Its strength lies in standardization, making it a favourite among large organisations. For example, a global retailer might use this format in its annual engagement survey to compare satisfaction levels between its North American and European divisions, identifying specific areas like "Opportunities for Growth" that require targeted investment. Similarly, a healthcare network can use it to quantify staff burnout, linking lower agreement on "I have a manageable workload" to higher turnover rates in specific departments.
Strategic Application and Best Practices
To maximize the value of this employee opinion survey example, focus on precision and actionable insights.
- Keep Questions Focused: Each question should address a single, specific concept. Avoid "double-barrelled" questions like "My manager is supportive and provides clear goals," as an employee may agree with one part but not the other.
- Balance Your Scale: While a five-point scale is common, consider a four-point or six-point scale to eliminate the neutral "middle" option. This forces a clearer indication of positive or negative sentiment, preventing non-committal responses that obscure true feelings.
- Ensure Anonymity: Emphasize that responses are confidential. This is non-negotiable for gathering honest feedback on sensitive topics like leadership effectiveness and compensation fairness.
Strategic Insight: The true power of Likert scale data is unlocked when it moves beyond a simple HR report. By integrating survey results into a business intelligence tool like Wurkn, you can correlate engagement scores directly with performance metrics. For example, you can analyze how a 10% increase in scores related to "manager effectiveness" impacts team productivity or customer satisfaction ratings in real-time, turning feedback from a traditional HR survey tool into a predictive strategic asset.
2. The Net Promoter Score (NPS) Employee Version
The Employee Net Promoter Score (eNPS) adapts the widely recognised customer loyalty metric to measure employee advocacy. It centres on one pivotal question: "On a scale of 0-10, how likely are you to recommend our organisation as a great place to work?" Popularised by Fred Reichheld and Bain & Company, this employee opinion survey example simplifies engagement into a single, powerful score (Reichheld, F., 2003, The One Number You Need to Grow). It provides a quick, high-level pulse on organisational health and employee loyalty.
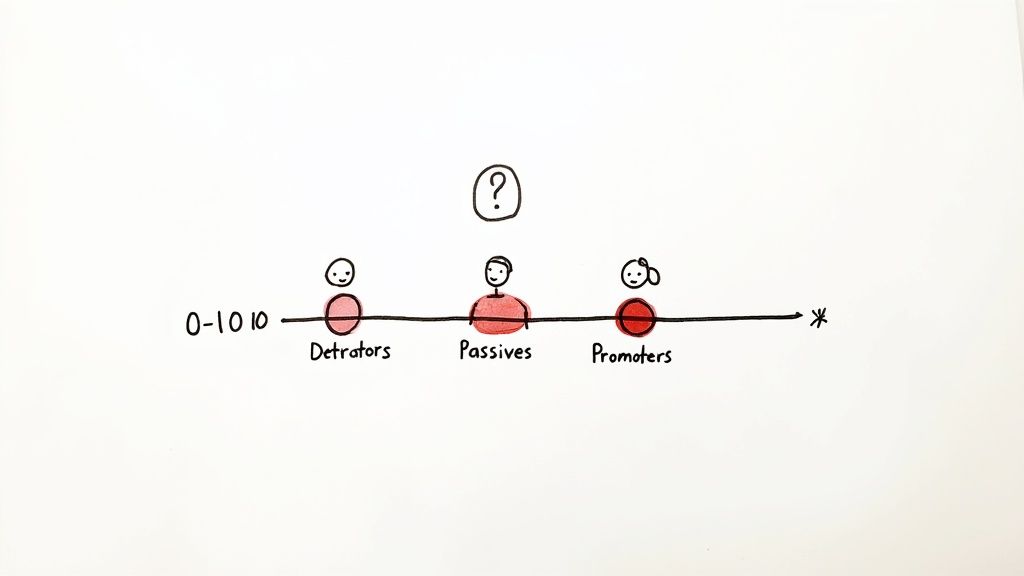
Its strength is its simplicity and directness, making it ideal for frequent, low-friction check-ins. For example, a fast-growing tech firm might deploy a quarterly eNPS survey to monitor how rapid scaling impacts its culture, identifying potential dips in advocacy before they escalate. Similarly, a major logistics company can use a modified eNPS in its fulfillment centres to get a rapid read on team morale, allowing site leaders to address issues flagged by "Detractors" (those scoring 0-6) almost immediately.
Strategic Application and Best Practices
To transform the eNPS from a simple score into a strategic tool, context and follow-up are critical.
- Ask "Why?": The score itself is just a number. The real value comes from an open-ended follow-up question, such as, "What is the primary reason for your score?" This qualitative feedback explains what drives both loyalty and dissatisfaction.
- Segment Your Data: Do not stop at a single organisational score. Segment eNPS results by department, tenure, location, and manager. This reveals pockets of high engagement to learn from and high-risk areas needing intervention.
- Track Trends, Not Just Scores: A single eNPS score is a snapshot. The true insight comes from tracking the trend over time. A declining score, even if still positive, is an early warning signal for leadership to investigate.
Strategic Insight: While an eNPS score provides a valuable KPI, its impact multiplies when integrated into a broader business intelligence framework. By feeding eNPS data into a platform like Wurkn, you can correlate advocacy scores with operational metrics. For instance, you could analyze how a 5-point increase in a department's eNPS score correlates with a reduction in absenteeism or an improvement in safety incident rates, proving the tangible business value of a highly engaged and loyal workforce beyond what a typical employee engagement platform can show.
3. Gallup Q12 Employee Engagement Survey
The Gallup Q12 survey is a globally recognised, scientifically-validated tool designed to measure the core elements of employee engagement. Developed over decades of research, its 12 questions are directly linked to critical business outcomes like profitability, productivity, and retention (Gallup, Inc., 2020, The Relationship Between Engagement at Work and Organizational Outcomes). This employee opinion survey example moves beyond simple satisfaction to gauge an employee's psychological commitment and connection to their role and the organisation.
Its power lies in its prescriptive nature; the questions themselves outline the conditions needed for an engaged workforce. For instance, a leading manufacturing company implemented the Q12 framework and focused manager training specifically on the 12 items. This led to a significant increase in engagement scores and a corresponding drop in staff turnover in their highest-performing plants. Similarly, healthcare systems use the Q12 to pinpoint drivers of nursing burnout, discovering that low scores on "I have the materials and equipment I need to do my work right" are a leading indicator of intent to leave.
Strategic Application and Best Practices
To leverage the Q12 effectively, the focus must be on team-level action and continuous improvement.
- Empower Team Leaders: The results are most powerful when shared directly with team managers. Equip them with the training and resources to hold conversations with their teams about the survey results and co-create action plans.
- Focus on Leading Indicators: Questions like "I know what is expected of me at work" and "I have a best friend at work" are powerful leading indicators of team cohesion and performance. Prioritise action on these fundamental needs first.
- Maintain a Regular Cadence: Deploy the Q12 on a quarterly or bi-annual basis to track progress. This transforms the survey from a one-time event into a continuous listening and improvement cycle that builds momentum.
Strategic Insight: While the Q12 provides excellent benchmarks, integrating its data into a business intelligence platform like Wurkn elevates its strategic value beyond what a standard HR survey tool offers. By correlating Q12 scores with operational data, you can build predictive models. For example, a logistics company can map scores on "My supervisor, or someone at work, seems to care about me as a person" against safety incident rates, proving that empathetic leadership directly contributes to a safer, more productive workplace.
4. Pulse Survey Template (Short-Form Format)
The pulse survey is a short, frequent employee opinion survey example designed to capture a real-time snapshot of employee sentiment. Unlike comprehensive annual surveys, pulse surveys typically consist of only 3-5 questions and are deployed on a regular cadence, such as weekly, bi-weekly, or monthly. This high-frequency, low-effort format allows organisations to monitor the workforce's "pulse," track trends over time, and respond quickly to emerging issues before they escalate.
Its strength lies in its agility and immediacy. For instance, a software company might use a pulse survey to gauge immediate employee reactions to a significant internal policy change, gathering feedback within days instead of waiting months. Similarly, a global consulting firm can use pulse surveys to supplement its annual engagement survey, using them to check in on key initiatives and maintain a continuous dialogue with its massive, distributed workforce. This approach transforms feedback from a once-a-year event into an ongoing conversation.
Strategic Application and Best Practices
To maximise the value of this employee opinion survey example, focus on speed, relevance, and a clear feedback loop.
- Rotate Topics Strategically: Keep the survey fresh and relevant by rotating question topics. One month could focus on well-being, the next on manager support, and another on team collaboration, providing a holistic view over a quarter.
- Deploy Post-Event: Use pulse surveys for immediate feedback after significant events like company-wide town halls, a major project launch, or the announcement of organisational changes. This provides timely, context-specific insights.
- Share Results Rapidly: The compact nature of pulse surveys allows for quick analysis. Commit to sharing a summary of the findings and any planned actions with employees within 48-72 hours to demonstrate that their feedback is heard and valued.
Strategic Insight: Pulse surveys are the engine of a continuous feedback culture. When their data is channelled into a business intelligence platform like Wurkn, it moves beyond simple sentiment tracking. You can correlate a dip in pulse scores related to "psychological safety" with a simultaneous drop in a specific team's innovation output, or see how a spike in "clarity of direction" scores following a town hall impacts project completion rates. This creates a real-time cultural dashboard, allowing COOs to get actionable business insights from continuous employee feedback and make data-driven leadership decisions with unprecedented speed.
5. 360-Degree Feedback Employee Survey
The 360-Degree Feedback survey moves beyond the traditional top-down review, creating a holistic view of an employee's performance and behaviour by gathering confidential feedback from multiple sources. This multi-rater approach typically includes input from an individual's manager, peers, direct reports, and sometimes even external contacts like clients. The goal is to provide a well-rounded perspective, uncovering blind spots and highlighting strengths that a single manager might miss, as popularised by organisations like the Center for Creative Leadership.
Its value is primarily in developmental contexts. For example, a large enterprise technology company uses 360-degree reviews to help managers and directors identify specific leadership competencies that need improvement, such as communication or strategic thinking. Similarly, a professional services firm can leverage this format to assess how well its consultants collaborate with both internal teams and client stakeholders, providing nuanced insights that inform individual development plans and coaching assignments.
Strategic Application and Best Practices
To make this employee opinion survey example effective, the focus must be on psychological safety and development rather than evaluation.
- Prioritise Development Over Evaluation: Frame the 360-degree process strictly as a tool for growth. Tying the results directly to compensation or promotion decisions can encourage raters to be less candid, undermining the entire purpose of gathering honest, constructive feedback.
- Guarantee Anonymity and Confidentiality: Ensure that all feedback from peers and direct reports is aggregated and anonymised. A common best practice is to require a minimum of three to five raters in each category before a report is generated, protecting individual identities and encouraging candour.
- Provide Professional Coaching: Raw 360-degree feedback can be difficult to interpret and emotionally charged. Always provide access to a trained coach or HR business partner to help the employee process the results, identify key themes, and create an actionable development plan.
Strategic Insight: While traditional 360-degree feedback is often a point-in-time event, its data becomes a powerful strategic asset when integrated into a business intelligence platform. Within Wurkn, you can correlate anonymised 360-degree competency scores with ongoing project success rates or team retention metrics. This allows leaders to identify which specific leadership behaviours, such as 'fosters innovation' or 'provides clear direction', have the most significant impact on business outcomes, guiding targeted investment in leadership development programs. This approach elevates feedback from a simple HR process into a core business intelligence function.
6. Open-Ended Comment Employee Survey
The open-ended comment survey moves beyond scales and scores to capture the qualitative richness of employee voices. This employee opinion survey example prioritises text-based responses, allowing employees to articulate their thoughts, concerns, and suggestions in their own words. This approach provides deep contextual data that quantitative surveys often miss, revealing the "why" behind the numbers.
Its strength lies in uncovering nuanced insights and unforeseen issues. For example, a software company that values written communication can use this format to gather detailed feedback on new remote work policies, understanding specific challenges that a Likert scale might overlook. Similarly, a mission-driven non-profit can use open-ended questions to assess cultural alignment, asking employees to describe moments when they felt the organization's values were either upheld or compromised.
Strategic Application and Best Practices
To extract maximum value from this qualitative method, structure and analysis are paramount.
- Ask Specific, Guiding Questions: Avoid overly broad prompts like "Any feedback?" Instead, use focused questions such as, "What is one thing we could do to improve inter-departmental collaboration?" or "Describe a recent challenge you faced and what support would have been helpful."
- Establish a Clear Coding Framework: Before analysis, create a framework of themes you anticipate (e.g., leadership, communication, workload). As you analyse responses, you can code comments into these categories and create new ones for emerging topics, organising unstructured data into actionable themes.
- Guarantee Anonymity to Foster Candour: The detailed nature of open-ended feedback makes anonymity even more critical. Clearly communicate that responses are confidential and will be aggregated thematically to prevent individuals from being identified, encouraging honest and transparent input.
Strategic Insight: Qualitative data is a strategic goldmine, but manual analysis is time-consuming. By feeding open-ended responses into a business intelligence platform like Wurkn, you can use natural language processing (NLP) to automate sentiment analysis and thematic coding. This allows you to instantly identify recurring keywords and sentiment trends (e.g., a spike in negative comments mentioning "project deadlines" in the engineering department) and correlate them directly with business outcomes like project delays or sprint velocity, turning unstructured feedback into a predictive operational tool that far surpasses the capabilities of basic HR survey tools.
7. eNPS (Employee Net Promoter Score) with Demographic Segmentation
The Employee Net Promoter Score (eNPS) is a streamlined metric that gauges employee loyalty by asking one pivotal question: "On a scale of 0 to 10, how likely are you to recommend our company as a place to work?" (Reichheld, F. F., 2003, The One Number You Need to Grow). By segmenting these results by demographics like department, tenure, or location, organisations transform this simple score into a powerful diagnostic tool, pinpointing exactly which employee populations are thriving and which are at risk.
This advanced approach to the eNPS employee opinion survey example moves beyond a single, company-wide score to reveal nuanced insights. For instance, a technology firm might discover its engineering department has a high eNPS of +50, while the sales team lags at -15. This segmentation immediately directs leadership attention to specific issues within the sales culture or compensation structure. Similarly, a retail organisation can segment by store location, identifying high-performing managers whose leadership practices can be replicated across the network.
Strategic Application and Best Practices
To leverage segmented eNPS, the focus must be on targeted action and continuous monitoring.
- Ensure Segment Validity: For data to be statistically sound and to protect anonymity, each segment should contain a minimum of 30 responses. If a segment is too small, combine it with a larger, relevant group (e.g., "new hires 0-3 months" and "new hires 3-6 months" could become "new hires 0-6 months").
- Prioritize Trends Over Scores: A single eNPS score is a snapshot; the real value lies in tracking the trend of each segment over time. A marketing team's score moving from +10 to +30 over six months is a stronger indicator of successful intervention than a stagnant score of +35 elsewhere.
- Conduct Targeted Follow-ups: Once you identify a low-scoring segment, deploy qualitative follow-up surveys with open-ended questions specifically for that group. Ask detractors in the finance department, "What is the primary reason for your score?" to uncover actionable feedback.
Strategic Insight: The true competitive advantage of segmented eNPS is realized when it’s integrated into a dynamic business intelligence dashboard. Within a platform like Wurkn, you can correlate a drop in eNPS for employees with over five years of tenure directly with an increase in voluntary turnover in that same group. This allows you to predict attrition risks and intervene with targeted retention programs before your most experienced talent walks out the door. Learn more about how to implement and track eNPS on wurkn.com.
8. Wellbeing and Work-Life Balance Employee Survey
The wellbeing and work-life balance survey is a specialised instrument designed to move beyond traditional engagement metrics and assess the holistic health of employees. This employee opinion survey example measures key dimensions such as mental health, financial wellness, physical health, and social connection. As organisations recognise the direct link between employee wellbeing and productivity, this survey provides a structured framework for understanding and supporting the whole person, not just the professional.
Its value lies in diagnosing specific stress points before they lead to burnout or turnover. For instance, a tech company might use this survey to discover that while engagement is high, a significant portion of its engineering team is struggling with financial anxiety. Similarly, a professional services firm can use the data to understand the impact of high-pressure deadlines on employee mental health, allowing them to implement targeted support like subsidised therapy sessions or mandatory "no-meeting Fridays" to promote restorative downtime.
Strategic Application and Best Practices
To effectively deploy this survey, the focus must be on creating a safe environment for honest disclosure and a clear path to action.
- Guarantee Confidentiality: Given the sensitive nature of questions about mental and financial health, absolute anonymity and secure data handling are critical. Clearly communicate the privacy measures in place to build trust and encourage candid responses.
- Include Actionable Resources: Don't just ask about problems; provide immediate avenues for support. Conclude the survey with links to the company’s Employee Assistance Program (EAP), mental health resources, or financial counselling services.
- Partner with Professionals: Collaborate with occupational health or mental wellness experts to design questions that are both sensitive and clinically sound. This ensures the data collected is valid and the follow-up actions are appropriate.
Strategic Insight: Wellbeing data becomes a powerful strategic asset when integrated into a business intelligence tool like Wurkn. Instead of just seeing that 40% of employees report feeling stressed, you can correlate that data with absenteeism rates, team performance metrics, or customer satisfaction scores. This allows you to build a business case for wellness initiatives by demonstrating how a 15% improvement in reported work-life balance in the customer support team leads to a measurable decrease in ticket resolution times and an increase in Net Promoter Score (NPS), directly linking employee health to business outcomes. Learn more about achieving work-life balance on wurkn.com.
8-Method Employee Survey Comparison
| Template | 🔄 Implementation complexity | ⚡ Resource & time (speed/efficiency) | ⭐ Expected quality / effectiveness | 📊 Typical outcomes / impact | 💡 Ideal use cases / key advantages |
|---|---|---|---|---|---|
| Likert Scale Employee Opinion Survey | 🔄🔄 — Standardized design; moderate setup for 20–50 items | ⚡⚡ — Quick to complete; straightforward analysis | ⭐⭐⭐⭐ — Reliable, statistically valid for trends | Produces comparable dimension scores and longitudinal trend data | Broad engagement measurement, benchmarking, regular tracking |
| Net Promoter Score (Employee Version) | 🔄 — Single-question core; minimal design work | ⚡⚡⚡ — Very fast (1 main Q + optional follow-ups) | ⭐⭐ — Clear signal but limited depth | Single loyalty metric; easy benchmarking and segment flags | Quick leadership dashboard, pulse advocacy checks |
| Gallup Q12 Employee Engagement Survey | 🔄🔄🔄 — Validated instrument; licensing and governance required | ⚡⚡ — Concise (12 items) but needs consulting for interpretation | ⭐⭐⭐⭐⭐ — High predictive validity for retention & performance | Industry benchmarks; strong correlation with business outcomes | Gold-standard engagement measurement and comparative benchmarking |
| Pulse Survey Template (Short-Form) | 🔄 — Low; simple short questionnaires deployed frequently | ⚡⚡⚡⚡ — Extremely fast (3–5 Q), mobile-friendly | ⭐⭐⭐ — Timely signals but limited scope per run | Rapid trend detection, event feedback, high response rates | Real-time monitoring, rapid iteration, testing specific initiatives |
| 360-Degree Feedback Employee Survey | 🔄🔄🔄🔄 — Complex multi-rater design; facilitation required | ⚡ — Time-consuming for respondents and analysts | ⭐⭐⭐⭐ — Deep behavioral insight for development | Individual reports, blind-spot identification, leadership development | Leadership development, succession planning, coaching |
| Open-Ended Comment Employee Survey | 🔄🔄 — Questionnaire is simple; analysis is resource-heavy | ⚡ — Slower due to qualitative coding and review | ⭐⭐⭐ — Rich nuance; hard to quantify at scale | Thematic insights, verbatim quotes, unanticipated issues surfaced | Culture exploration, deep-dive feedback, qualitative discovery |
| eNPS with Demographic Segmentation | 🔄🔄 — Adds segmentation design and privacy considerations | ⚡⚡ — Moderate (8–12 Q); needs larger sample sizes for segments | ⭐⭐⭐⭐ — Actionable when segments are statistically valid | Segment-specific NPS scores; targeted intervention priorities | Identify at-risk groups, targeted retention strategies, dept-level action |
| Wellbeing & Work-Life Balance Survey | 🔄🔄 — Specialized content; may require clinical/HR input | ⚡ — Moderate to slow (15–25 Q) plus follow-up support | ⭐⭐⭐⭐ — High relevance to retention, health, and productivity | Burnout indicators, program ROI data, early risk detection | Design wellness programs, monitor mental health and work-life balance |
Beyond Surveys: Activating Your Cultural Business Intelligence
Throughout this article, we’ve explored a diverse array of powerful tools, from the structured Gallup Q12 to the nimble Pulse Survey and the holistic 360-Degree Feedback model. Each employee opinion survey example serves as a vital diagnostic instrument, offering a structured method to capture a snapshot of your organisation’s health, engagement levels, and cultural dynamics at a specific moment in time.
These templates are more than just question sets; they are strategic frameworks. They provide a blueprint for understanding everything from day-to-day engagement and team collaboration to long-term career satisfaction and overall wellbeing. By using them, you can start to quantify abstract concepts, turning subjective feelings into objective data points that can be tracked, analysed, and acted upon.
However, the true potential of employee feedback is realised when we move beyond these periodic snapshots. The modern workplace operates in real-time, and your approach to understanding your people must as well. The ultimate goal isn't just to run surveys, but to cultivate a continuous, living stream of cultural intelligence.
From Static Data to Dynamic Strategy
The fundamental limitation of any traditional survey, no matter how well-designed, is its static nature. The results tell you what was happening last quarter or last month. By the time you’ve analysed the data and formulated an action plan, the organisational landscape may have already shifted. This is the critical gap where proactive leadership becomes reactive problem-solving.
To bridge this gap, leaders must evolve their thinking:
- From Event to Ecosystem: View feedback not as an annual or quarterly event, but as an always-on ecosystem. The principles behind each employee opinion survey example should inform a continuous listening strategy.
- From Symptoms to Root Causes: Point-in-time surveys often reveal symptoms (e.g., low engagement scores). A continuous intelligence model helps you diagnose the root causes in real-time (e.g., communication breakdowns on a specific project, unclear leadership direction).
- From Lagging to Leading Indicators: Survey results are lagging indicators of culture. Continuous feedback, drawn from the daily flow of work, provides leading indicators that allow you to anticipate challenges and opportunities before they significantly impact business KPIs.
Activating Culture as a Business Function
This is where a business intelligence tool designed for cultural data, like Wurkn, fundamentally changes the game. Wurkn transcends the limitations of traditional survey platforms by tapping into the unstructured, anonymized conversations already happening in your digital collaboration hubs, such as Slack and Microsoft Teams. It doesn't rely on employees stopping their work to fill out a form; it listens to the natural pulse of the organisation.
By applying sophisticated AI analysis with essential human oversight, Wurkn synthesizes this constant stream of data into a real-time, strategic dashboard. People Operations leaders and COOs can see how key cultural themes like psychological safety, recognition, or clarity of purpose are trending day-by-day. Crucially, it connects these cultural metrics directly to tangible business outcomes. You can finally draw a clear, data-backed line from employee sentiment to productivity, from communication quality to retention rates, and from team morale to revenue performance.
By integrating the strategic intent of the employee opinion survey examples we've discussed into a continuous intelligence platform, you are no longer just measuring employee opinions. You are actively managing your culture as a core business lever, equipped with the real-time insights needed to build a resilient, innovative, and high-performing organisation.
Ready to move beyond static surveys and activate real-time cultural intelligence? See how Wurkn transforms unstructured employee feedback into a strategic asset, connecting cultural health directly to your most critical business KPIs. Discover the Wurkn platform today.