The cost of employee turnover isn't just a line item; it's a silent killer of profitability. Most leaders in the United States and Canada are shocked to learn that losing a single employee costs anywhere from 1.5 to 2 times their annual salary (Society for Human Resource Management, 2022) when you factor in everything from recruitment and training to lost productivity.
This isn't just an HR problem. It’s a critical business threat that quietly erodes your bottom line.
The Hidden Drain on Your Company's Profits
Employee turnover is far more than a metric on a dashboard; think of it as a slow, persistent leak in your company's revenue pipeline. Day-to-day, you might not notice it. But over a year, the cumulative effect can be staggering, siphoning away resources and kneecapping growth in both Canada and the United States.
Every time an employee walks out the door, it triggers a cascade of costs. Some are obvious, but many are invisible, lurking just beneath the surface of your profit and loss statement. It's a hidden tax on your entire operation.
Direct vs. Indirect Turnover Costs
To really grasp the financial impact, you have to look beyond the final paycheque. The costs break down into two main categories:
- Direct Costs: These are the tangible, easy-to-calculate expenses. Think advertising fees for the job opening, recruitment agency invoices, background check services, and the administrative overhead of processing a new hire. For instance, if you pay a recruiter a typical 20% fee on a new hire's $80,000 salary, that's an immediate $16,000 cost.
- Indirect Costs: These are the sneaky, intangible expenses that do the most damage. This is where you find the lost productivity while the role sits empty, the countless hours your managers spend interviewing candidates instead of leading their teams, and the slow ramp-up period where a new employee is still learning the ropes. For example, if a manager earning $100,000 a year spends 40 hours on hiring, that's nearly $2,000 of their time diverted from strategic work.
The single most underestimated cost is the loss of institutional knowledge. When a veteran employee leaves, they take undocumented processes, critical client relationships, and years of hard-won experience with them. That’s a loss that can take years to rebuild.
Turnover Costs at a Glance: Direct vs. Indirect Expenses
Here’s a quick breakdown to frame the tangible and intangible costs we're talking about. The indirect costs are often where the real financial pain lies.
| Cost Category | Examples of Expenses |
|---|---|
| Direct Costs | Recruitment agency fees, job board postings, pre-employment screening, signing bonuses, temporary staffing costs, travel expenses for interviews. |
| Indirect Costs | Lost productivity from the vacant role, time spent by managers and teams on interviewing, training and onboarding time for the new hire, decreased team morale, loss of institutional knowledge and client relationships. |
The indirect costs add up fast and are precisely what most traditional measurement tools fail to capture effectively.
Traditional annual surveys are like an autopsy—they tell you why someone left long after it's too late to do anything about it. They provide a historical snapshot but completely miss the real-time signals that precede a departure, like declining morale or a breakdown in psychological safety. Understanding the impact of workplace incivility on revenue and staff attrition is a crucial first step in spotting these hidden cultural issues before they fester.
This is where a business intelligence tool like Wurkn gives you a massive advantage. Instead of relying on infrequent, backward-looking surveys, Wurkn provides a continuous, anonymous feedback loop. It transforms employee sentiment into predictive insights, acting as an early warning system. This allows leaders to spot and fix the root causes of disengagement before they escalate into costly turnover—effectively patching the leaks in your revenue pipeline before they become a full-blown flood.
How to Calculate Your Cost of Employee Turnover
Knowing that employee turnover is expensive is one thing. Putting an actual dollar figure on it is something else entirely. Moving from theory to a real-world calculation is the only way to get finance and operations leaders to sit up and take notice.
When you can turn a vague HR problem into a hard number, you transform the conversation. The goal is to break down the total cost into three buckets: the obvious expenses, the hidden productivity drains, and the lost future potential.
Each category peels back another layer of the financial impact, showing just how deeply a single departure can affect the business.
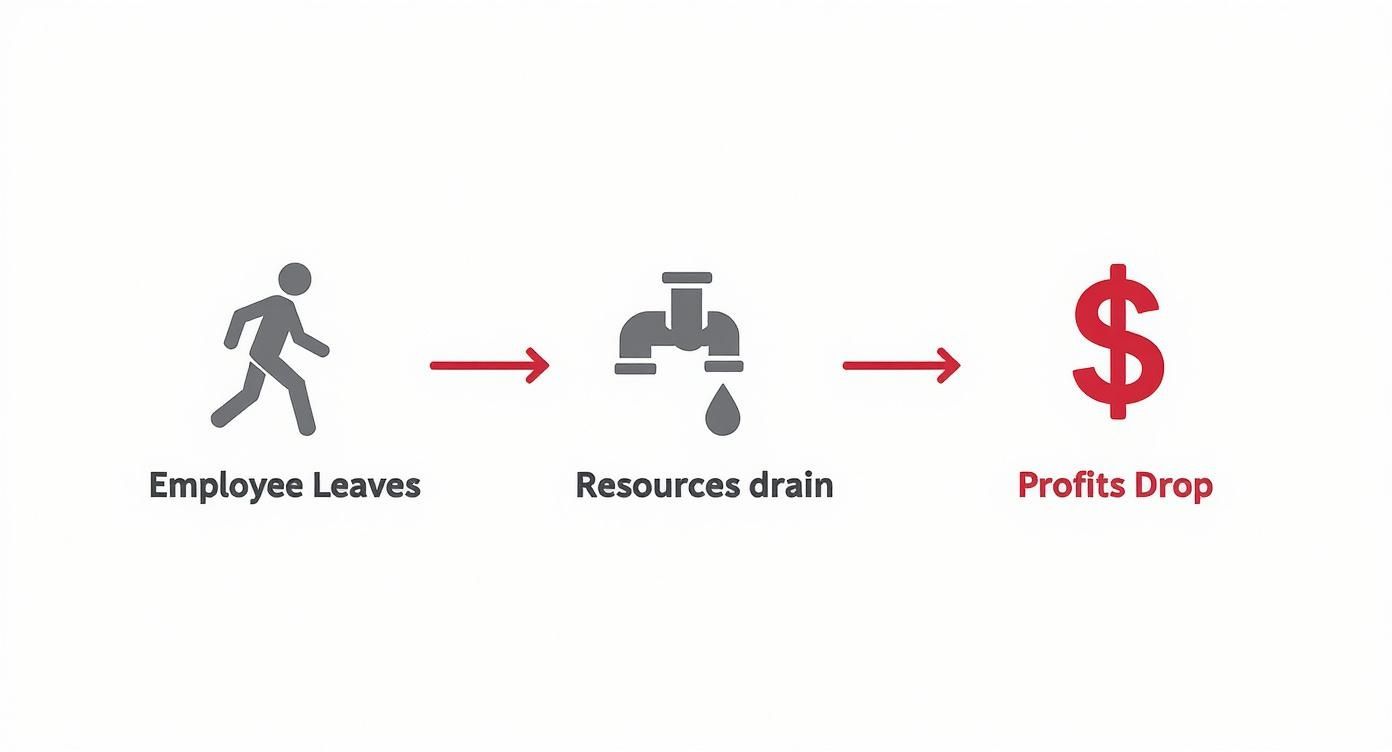
As you can see, one person leaving kicks off a chain reaction. It’s a resource drain—both in money and in knowledge—that leads directly to a hit on your profits.
To help you get started, we've put together a simple worksheet. Think of this as your template for turning abstract costs into concrete figures that you can actually use.
Employee Turnover Cost Calculation Worksheet
This table breaks down the components you'll need to consider. Use the formulas as a guide to start plugging in your own company's numbers.
| Cost Component | Formula / How to Calculate | Example Value (Mid-Level Role) |
|---|---|---|
| Separation Costs | (HR Admin Hours x HR Wage) + (Manager Hours x Manager Wage) + Severance Pay | $1,500 |
| Recruitment Costs | Job Board Fees + Agency Fees + Background Check Costs | $8,000 |
| Hiring Costs | (Total Interview Hours for all Staff) x (Average Interviewer Wage) | $4,500 |
| Lost Productivity (Vacancy) | (Employee's Annual Salary / 260) x Days Vacant | $15,000 |
| New Hire Ramp-Up | (New Hire Salary for 3 Months) x 50% Productivity Loss | $12,500 |
| Training Costs (Internal) | (Manager Training Hours x Manager Wage) + (Peer Training Hours x Peer Wage) | $5,000 |
| Opportunity Cost (Sales) | Lost Quota or Revenue Potential During Vacancy (e.g., one quarter) | $250,000 |
Once you've filled in these values, you can see how quickly the costs add up, turning a single departure into a significant financial event. Let's dig into each of these categories a bit more.
Breaking Down Direct Costs
Direct costs are the easy ones—they're the expenses you can see on an invoice or a payroll report. These are the tangible, out-of-pocket payments your company makes to manage a departure and find a replacement.
Think of things like:
- Separation Costs: This isn't just a final paycheque. It includes any severance you pay out, plus the administrative time your HR team and managers spend on exit interviews and all the offboarding paperwork.
- Recruitment Costs: This is where the numbers get big, fast. Add up the fees for posting on job boards, payments to external recruiters (which can easily hit 15-25% of the new hire's first-year salary), and any pre-employment screening services like background checks.
- Hiring Costs: Don't forget the value of your team's time. Calculate the hourly wages for every manager and HR staff member involved in the hiring process and multiply it by the hours they spent sifting through resumes, conducting interviews, and making a final decision.
Uncovering Indirect Costs
Here’s where the real damage happens. Indirect costs are much harder to see on a balance sheet, but they are often far more substantial than the direct expenses. They represent the quiet drain on productivity and the operational strain that ripples through the organization when someone leaves.
The biggest culprit is the productivity vacuum. It’s not just about an empty desk; it’s the domino effect on the rest of the team. They have to pick up the slack, which can lead to burnout, lower morale, and a drop in their own performance.
These are the key indirect costs you need to quantify:
- Lost Productivity of Vacant Role: What was that person contributing every day? A simple way to estimate this is to take their annual salary and divide it by 260 (the rough number of working days in a year). Multiply that daily value by the number of days the role stays empty.
- New Hire Ramp-Up Time: A new employee is a net drain before they become a net contributor. They aren’t hitting their full stride on day one. It can take months, sometimes even a year or two, to reach the output of the person they replaced. A conservative estimate is to assume they operate at 50% productivity for their first three months.
- Manager and Team Training Time: Every hour a manager or a teammate spends training the new hire is an hour they aren't doing their own job. This is a massive hidden cost that pulls your most experienced people away from their core responsibilities.
Calculating Opportunity Costs
Finally, we get to opportunity costs. This is the potential business you lost because that role was empty or in transition. While it's the hardest category to pin down, it’s absolutely critical for understanding the true business impact, especially for roles in sales, innovation, or client relations.
A vacant sales role isn't just a missing person; it's a direct leak in your revenue pipeline.
For example, imagine a salesperson with a quarterly quota of $250,000. If that position is empty for a full quarter, the opportunity cost is a straightforward $250,000 in lost sales. But it gets worse. Strained client relationships during the handover can lead to long-term customer churn, representing an even bigger financial hit down the road.
If you want to play around with these numbers yourself, you can use Wurkn’s simple attrition calculator to model different scenarios and see the costs stack up.
By calculating these three areas, you get a comprehensive and defensible figure for your total cost of employee turnover. This isn’t just an interesting HR metric; it’s the financial proof you need to justify investing in proactive retention strategies. Instead of relying on annual surveys that only tell you why people already left, a business intelligence tool like Wurkn provides the continuous cultural data needed to see problems coming and prevent them—turning a major cost centre into a real competitive advantage.
The Ripple Effect of Losing a Team Member
The direct financial costs of employee turnover are bad enough, but they're only half the story. The real damage happens beneath the surface. A single person's departure can set off a destructive ripple effect through your entire organization—a bit like one domino tipping over and starting a chain reaction.
These consequences are trickier to put a number on, but they can be far more corrosive to your business in the long run. When someone leaves, it’s never a clean break. It creates a vacuum that disrupts everything from daily workflows to your most important strategic goals. The true cost is found in these unmeasured, cascading effects that quietly degrade performance from the inside out.

The Contagion of Turnover and Morale
One of the most immediate and dangerous ripple effects is something experts call turnover contagion. It’s a simple but powerful idea: when a colleague resigns, the people left behind start questioning their own happiness and future with the company. It plants a seed of doubt, prompting them to quietly polish their CVs or start browsing job boards.
This gets worse when you factor in the heavier workload. The remaining team members are forced to pick up the slack, often without any extra pay, which quickly leads to burnout and resentment. This cycle of overwork and tanking morale makes your best people prime targets for recruiters, turning one resignation into several.
This is a massive operational headache for businesses across North America. For example, in California, where employers averaged 501,000 separations per month over a recent 12-month period, this exact contagion effect is a major amplifier. You can read more about it in this detailed report on the California jobs market and its operational impacts.
The departure of one respected team member acts as social proof to others that it’s time to leave. It silently communicates that better opportunities exist elsewhere, making it a powerful catalyst for further attrition.
The Critical Loss of Institutional Knowledge
Another profound, often overlooked cost is the loss of institutional knowledge. This isn't the stuff written down in manuals; it's the unwritten rules, the nuanced client relationships, and the undocumented processes that a seasoned employee just knows. It's the practical wisdom that keeps your team running smoothly, and when that person walks out the door, it can take years to rebuild.
Think about what you really lose:
- Process Expertise: That veteran who knows exactly how to troubleshoot a legacy system or navigate complex internal approvals without a guide.
- Client Relationships: The account manager who has spent years building trust with a key customer, understanding their business inside and out.
- Internal Networks: The person who knows exactly who to call in another department to get things done quickly, bypassing all the red tape.
When this knowledge disappears, productivity grinds to a halt. Projects get delayed, customer satisfaction plummets, and the new hire is left trying to reinvent the wheel—making expensive mistakes along the way. Innovation suffers, too, as your team spends more time relearning old lessons than creating new value.
How Hidden Impacts Degrade Long-Term Strategy
Ultimately, these ripple effects directly sabotage your company's ability to execute its long-term strategy. Constant churn destroys team cohesion, making it nearly impossible to build momentum on key initiatives. Customer service quality becomes inconsistent, damaging your brand's reputation and leading to customer attrition.
This is exactly where traditional HR tools like annual surveys fall flat. A survey might tell you that morale was low six months ago, but it won’t give you the real-time, nuanced insights needed to see these ripples as they start. It's like trying to drive by only looking in the rearview mirror.
In contrast, a business intelligence tool like Wurkn gives you a continuous, anonymous view into the cultural currents of your organization. By analyzing employee sentiment in real-time, it acts as an early-warning system, flagging the subtle shifts in morale that signal a potential turnover contagion event. This allows leaders to stop reacting to departures and start proactively fixing the root causes—turning a vicious cycle of attrition into a virtuous one of retention and stability.
How Do You Know If Your Turnover Rate Is Good or Bad? Look at the Benchmarks
Once you’ve calculated the hard numbers behind your employee turnover, the real question emerges: "So… is this number good or bad?" A turnover cost on its own is just a figure; it only tells a story when you give it context. Comparing your rate against industry and regional benchmarks is like turning on the lights in a dark room—it immediately shows you where you stand and what’s actually possible.
This isn't just an academic exercise. For businesses in Canada and the United States, understanding these benchmarks is critical. A 40% turnover rate might seem like a catastrophe, but in the fast-paced hospitality sector, that could be painfully close to the norm. Take that same 40% and apply it to a more stable industry like finance or government, and it’s a five-alarm fire signalling deep-rooted cultural or operational problems.
Ultimately, this comparison defines your competitive position in the unending war for talent.
What Is a Good Employee Turnover Rate?
Let’s get one thing straight: a universally “good” turnover rate doesn’t exist. It’s completely dependent on your industry. However, a decent rule of thumb is that an annual turnover rate of around 10% is considered healthy. It’s enough to bring in fresh perspectives without causing major disruption. But again, context is everything.
Look at the massive variations across key sectors in North America:
- Retail and Hospitality: These industries are turnover hotspots, often seeing rates that blast past 50% annually. This is largely driven by the nature of seasonal, part-time, and entry-level work.
- Technology: The tech world is a battlefield for talent. Average turnover often lands between 13% and 15% because the high demand for specialized skills means your best people always have other options.
- Healthcare: This field is dealing with immense pressure and burnout. Turnover can swing wildly, from 15% for highly specialized roles to much, much higher for essential support staff.
Even if your turnover rate is just "average" for your industry, you're sitting on a massive opportunity. Settling for the status quo means you're leaving huge cost savings and productivity gains on the table. Meanwhile, your competitors who get ahead of the curve are building a powerful, sustainable advantage.
Interpreting Regional Data and Setting a Smarter Goal
Beyond your industry, regional data adds another crucial layer of insight. Local economic conditions, the cost of living, and the density of the local talent pool all have a huge impact on how often people jump ship.
For example, employee turnover in California has been a significant challenge, with a recent annual turnover rate of 20.1%. Even with recent declines, specific sectors felt the heat, with hospitality at 50.3% and healthcare at 25.9%. For a typical California company with 1,000 employees, a 20.1% turnover rate means 201 employees walk out the door every year. That’s not a small number. You can find more detail on these employee turnover rate declines and their industry-specific impacts.
This is the kind of data that creates clarity. If your tech company in California has a 12% turnover rate, you’re crushing both the tech industry average and the regional average. That’s a powerful story to tell stakeholders. But if your rate is 25%, you now have a clear, data-backed mandate for immediate action.
This is where a cultural business intelligence tool like Wurkn goes way beyond simple HR metrics. Traditional surveys give you a single, static data point. Wurkn gives you a continuous, live feed of the cultural signals actually driving your turnover. It helps you understand the why behind your numbers, allowing you to set realistic reduction goals and proactively fix issues before they ever show up in an exit interview.
Instead of just reacting to benchmark data, you can start leading it.
Moving from Reactive to Predictive Retention Strategies
Figuring out your cost of employee turnover is a vital first step. It’s like checking your location on a map—it tells you exactly where you stand. But to really get ahead, you can’t just keep looking in the rearview mirror. You have to start looking at the road ahead.
It’s time to shift from being reactive to becoming predictive.
For too long, the standard playbook for employee retention has been completely reactive. The go-to tool? The annual engagement survey. This exercise often feels more like performing an autopsy than a health check-up. By the time you get the results, the problems have been festering for months, and your best people might have already walked out the door.
These surveys tell you why someone left long after it's too late to do anything about it. They give you a static, old photo of a workforce culture that’s actually dynamic and constantly changing. This model is fundamentally broken because it misses the faint, early signals of disengagement that show up long before a resignation letter lands on your desk.
The Shift to Real-Time Cultural Intelligence
A modern, smarter approach requires a total change in how we listen to our people. Instead of a once-a-year data dump, leaders across Canada and the United States need a continuous, real-time diagnostic tool. This is precisely where a business intelligence platform like Wurkn delivers value that goes way beyond traditional HR survey tools.
Wurkn isn’t just another employee engagement platform; it’s a cultural intelligence engine. It’s designed to pick up on the subtle signals of burnout, cultural friction, and flagging morale as they happen. By integrating right into the daily workflow, it gathers anonymous feedback all the time, turning fuzzy feelings into a live dashboard of your company’s health.
This lets leadership see not just what is happening, but why it's happening—right now.
Traditional surveys are great at measuring the past. A cultural business intelligence platform helps you shape the future. It’s the difference between documenting a problem and preventing it from ever happening.
This proactive approach is the key to slashing the high cost of employee turnover. It gets you out of the cycle of reacting to exit interviews and into the proactive space of understanding the leading indicators of attrition, which allows for timely, targeted interventions that actually work.
Connecting Cultural Data to Financial Outcomes
The real power here is connecting the dots between cultural data and your bottom line. A simple feedback tool might tell you a team is unhappy. A business intelligence platform like Wurkn can show you how that unhappiness correlates with a drop in productivity, a spike in customer complaints, or a serious attrition risk in a department that drives revenue.
Think about this real-world example:
Wurkn's continuous analysis flags a "hotspot" of negative sentiment building around a specific team lead. The anonymous feedback reveals that team members feel micromanaged and unsupported, and the classic signs of burnout are starting to show.
- Reactive Approach: You wait for the annual survey. Nine months later, you see the low scores for that manager, but only after two of your top performers have already resigned. The cost is already sunk.
- Predictive Approach: The platform flags the rising negative sentiment in real time. Leadership gets an alert about a potential turnover risk and can step in immediately with targeted coaching for the manager and support for the team. The resignations are prevented before they can ever hit the balance sheet.
This is the core value: turning abstract cultural signals into concrete, actionable business intelligence. It’s about spotting the small fires before they turn into multi-million-dollar infernos.
Building a Proactive Retention Framework
When you implement a continuous listening strategy, you’re building a powerful, proactive retention framework. This isn't just about hoarding more data; it's about making smarter, faster decisions based on a live view of your organization's pulse. Instead of guessing, you can act with precision. For more ideas on building this out, check out our guide on the top retention strategies to keep your best employees.
This forward-thinking stance directly lowers recruitment costs, preserves priceless institutional knowledge, and keeps team morale and productivity high. It transforms retention from a defensive, reactive HR task into a strategic business imperative that drives sustainable growth and profitability.
Making the Financial Case for Employee Retention
When you truly grasp the financial weight of employee turnover, the entire conversation changes. Retention stops being a "soft" HR initiative and becomes a strategic, high-return investment. The numbers tell a very clear story: a modest investment in keeping your people, guided by real-time business intelligence, protects your bottom line in a big way.
This isn't about spending money; it's about making a strategic choice for financial stability and sustainable growth. Putting resources into the employee experience isn't a cost centre—it's one of the most powerful levers you have to improve profitability. The trick is to connect proactive cultural improvements to concrete financial outcomes, moving from guesswork to a data-driven strategy.
From Cost Centre to Profit Driver
Let’s walk through a clear scenario for a mid-sized company in Canada or the United States. Imagine a business with 200 employees and an industry-average turnover rate of 20%. That means they lose 40 people every year. If the average salary is $60,000, the annual cost of employee turnover can easily blow past $2 million. Now that's a number that gets a leader's attention.
This is where predictive insights become a game-changer. Instead of reacting to exit interviews after your best people have already left, you can get ahead of the problem and address the root causes of disengagement before they turn into resignations. A business intelligence tool like Wurkn gives you the continuous cultural data needed to spot these risks early on.
By transforming anonymous employee feedback into actionable intelligence, you can shift from managing a crisis to preventing one. This proactive stance is where the real return on investment is found, turning cultural health into a measurable financial asset.
Quantifying the Return on Retention
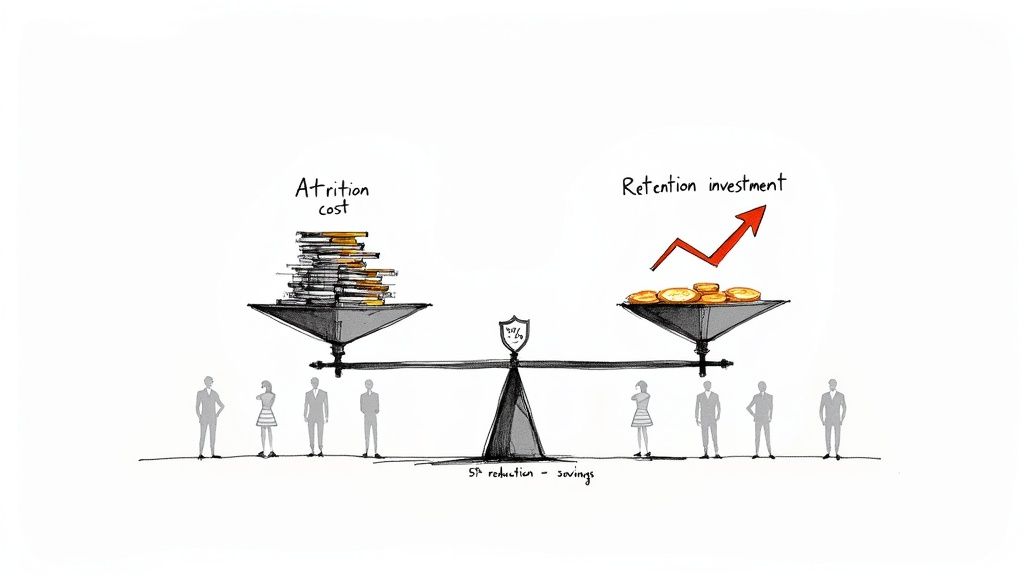
Let's stick with that same 200-person company. What if they used predictive insights to reduce their turnover by just 5%, bringing it down from 20% to 15%? That small shift means 10 fewer people walk out the door each year.
This seemingly minor improvement translates into over $500,000 in direct savings annually. Think about that.
That $500,000 is money that can be funnelled back into growth, innovation, or other strategic priorities instead of being drained by the endless cycle of recruiting and retraining. The financial case is undeniable: proactive retention isn’t just good for morale; it’s essential for smart, sustainable business management.
The cost to replace employees can be staggering, especially for more senior roles. In competitive regions like California, some estimates suggest replacing a single employee can cost up to 213% of their annual salary. You can dig into more of these job openings and labour turnover trends to see the bigger picture.
Ready to turn your cultural insights into a competitive advantage? See how Wurkn delivers the business intelligence you need to reduce turnover costs and drive sustainable growth. Explore Wurkn today.