Your company’s turnover rate is the percentage of employees who head for the exit over a certain period. It’s one of the most honest signals you can get about the health of your organization, telling you exactly how well you’re holding on to your talent.
What Your Employee Turnover Rate Really Costs Your Business
Let’s get past the dry, textbook definition. Employee turnover isn’t some passive HR metric you track on a dusty spreadsheet. It’s a flashing red light on your operational dashboard—a core business challenge for leaders across Canada and the United States.
Think of your company as a bucket holding your most valuable asset: your people. A high turnover rate is a leak in that bucket, constantly draining away skilled talent, deep institutional knowledge, and team morale. Every time someone walks out the door, they take more than just their laptop with them.
They leave a void that disrupts projects, overloads the remaining team members, and racks up serious costs. The Society for Human Resource Management (SHRM) pegs the cost of replacing an employee at anywhere from 50% to a staggering 200% of their annual salary. That number isn’t just about recruitment ads; it covers everything from interviewing and onboarding to months of lost productivity.
The Hidden Costs of Employee Turnover
The financial hit is big, but the real damage runs much deeper than what you’ll find on a balance sheet. When a key team member leaves, a shockwave of hidden costs ripples through the entire organization.
Here’s a quick breakdown of the direct and indirect costs that often go untracked:
| Cost Category | Description | Example Business Impact |
|---|---|---|
| Recruitment & Hiring | Direct costs like advertising, recruiter fees, and background checks. | Marketing spend on job boards, hours spent by managers in interviews instead of on revenue-generating activities. |
| Onboarding & Training | Costs for orientation, training programs, and initial setup. | A new sales rep might take 6+ months to build a pipeline, impacting quarterly revenue targets during that ramp-up. |
| Lost Productivity | The gap between a departing employee’s output and a new hire’s initial output. | Project deadlines are missed, and customer support quality dips as the new person learns the ropes. |
| Knowledge Drain | Loss of institutional memory, client relationships, and undocumented processes. | A senior engineer leaves, taking years of product knowledge that isn’t written down anywhere, slowing down future development. |
| Team Morale Impact | Remaining employees often feel overworked, unstable, and disengaged. | The “survivors” start updating their own resumes, creating a domino effect of further departures. |
These are the costs that don’t show up as a line item but can quietly cripple a department’s effectiveness and drag down the entire company’s performance.
Simply tracking your turnover rate isn’t enough. The real challenge—and the real opportunity—is understanding the why behind the numbers. By the time your annual engagement survey flags a problem, your best people are already gone.
From Lagging Indicators to Real-Time Intelligence
To get ahead of turnover, you have to stop relying on lagging indicators. The key is shifting to continuous, real-time cultural intelligence. This is where a business intelligence tool like Wurkn offers a completely different approach compared to traditional HR survey tools and basic employee engagement platforms.
Instead of waiting a year for feedback, Wurkn taps into the daily, anonymous conversations already happening on platforms like Slack and Microsoft Teams. It translates that raw employee sentiment into a living dashboard, giving COOs and People Ops leaders a direct line of sight into the early warning signs of burnout, disengagement, or cultural friction.
This proactive approach lets you see the cracks forming in your talent bucket long before they become catastrophic leaks, empowering you to build a resilient, retention-focused culture.
How to Calculate and Analyze Your Turnover Rate
Figuring out your company’s turnover rate is the essential first step to understanding what’s really going on with your people. At its heart, the formula is simple. It gives you a high-level snapshot of how many people are walking out the door over a set period—usually a year.
To get this number, you just need two pieces of information: how many employees left the company (for any reason), and what your average headcount was during that same timeframe.
The Standard Turnover Rate Formula
The calculation itself is straightforward. Just divide the total number of people who left by your average number of employees, then multiply by 100 to turn it into a percentage.
(Total Separations ÷ Average Number of Employees) x 100 = Turnover Rate %
Let’s make it real. Say a logistics company in Ontario, Canada had an average of 200 employees over the last year, and 30 of them left. The math looks like this: (30 ÷ 200) x 100 = 15%. Simple. Your annual turnover rate is 15%.
This single number is your starting line. Think of it as a vital health metric for your organization. But it’s just that—a start. A 15% turnover rate might be fantastic for a retail business in the United States, but it could be a five-alarm fire for a specialized software firm. The real, actionable insights only come when you start digging deeper and slicing up that data.
Beyond the Basics: Segmentation Is Key
A company-wide turnover rate is like a single dot on a giant map. It tells you where you are, but it gives you zero context about the terrain around you. To truly understand what’s driving people away, you have to break that top-line number into smaller, more meaningful pieces. This is where you graduate from basic reporting to strategic analysis.
This concept map shows exactly how turnover hits your talent pool, institutional knowledge, and, of course, your finances.
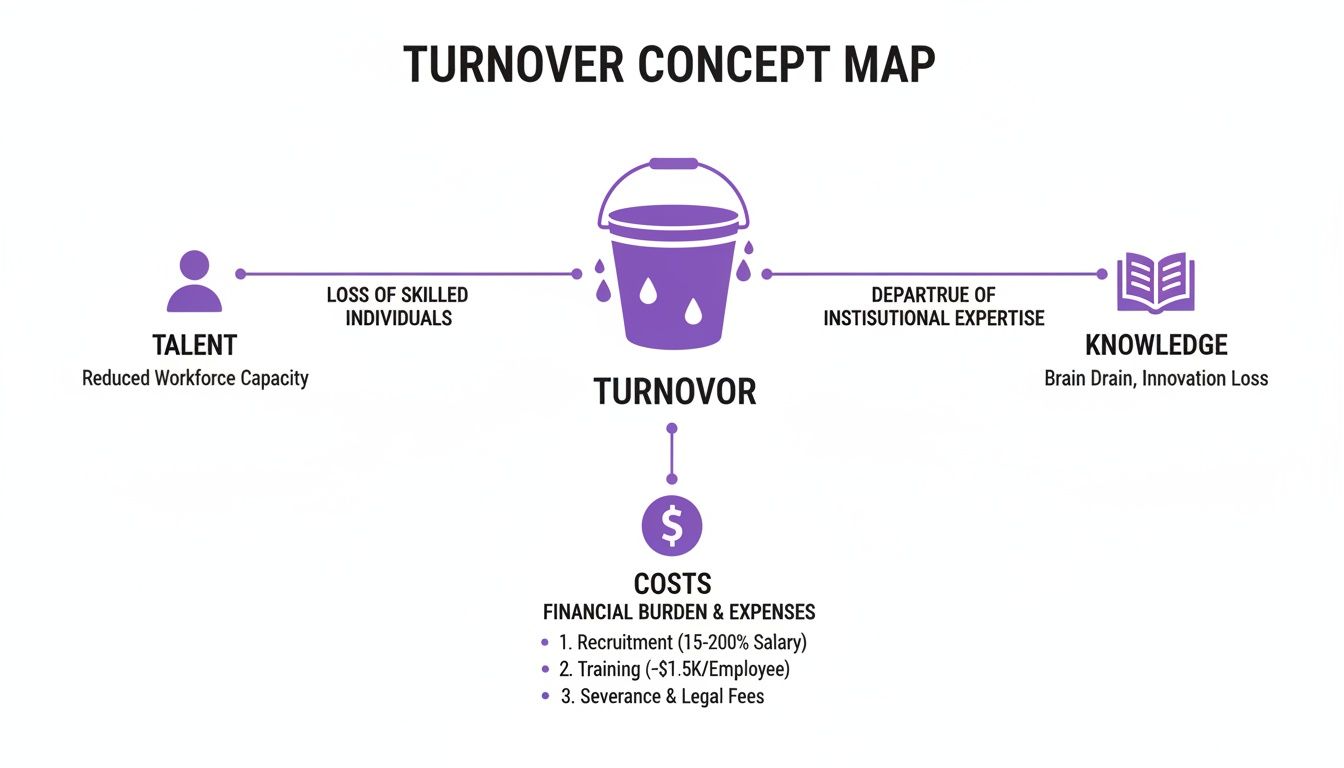
As you can see, every time someone leaves, it creates a ripple effect, draining critical assets and racking up costs that go way beyond a final paycheque.
Here are the most powerful ways to segment your turnover data:
- Voluntary vs. Involuntary: Are people choosing to leave, or are you asking them to go? A high rate of voluntary turnover is a huge red flag for culture, management, or burnout issues. On the other hand, high involuntary turnover might point to a broken hiring process or ineffective performance management.
- High vs. Low Performers: Losing a top performer is devastatingly more expensive than losing someone who consistently misses the mark. A 5% turnover rate among your top-quartile employees is a crisis. A 15% rate among your bottom quartile? That might actually be good for business.
- Department or Team: Is your engineering team rock-solid while the sales team is a revolving door? This helps you pinpoint specific leaders, toxic work environments, or compensation plans that are driving people away.
- Tenure: Are you losing new hires in their first year, or are seasoned veterans with 5+ years of experience heading for the exit? Each scenario points to a different problem. The first suggests a flawed onboarding process; the second signals a dead-end career path. For a deeper look at how this compares to other employee departure metrics, you can learn more by understanding your attrition rate.
- Location: For businesses in Canada or the US with multiple offices or remote teams, this is crucial. Finding a 25% turnover rate among your Toronto-based software engineers with 1-2 years of experience isn’t a vague, company-wide problem—it’s a specific, localized fire you can actually put out.
The Limits of Calculation
Slicing your data this way is powerful. It reveals the what and the where of your turnover problem with incredible clarity. But it still doesn’t tell you why. Knowing your junior sales team in Vancouver is leaving in droves is critical, but it doesn’t explain the human story behind the numbers.
This is the exact limitation of traditional HR metrics. They are lagging indicators; they describe a problem after it’s already happened.
To get ahead of turnover, you need a system that connects these numbers to the real-time, qualitative feelings of your employees. This is where a business intelligence tool like Wurkn goes beyond simple surveys. It provides that crucial layer of “why,” turning your data from a historical report into a proactive retention strategy.
The Real Reasons Your Best Employees Are Leaving
Knowing your turnover number is one thing. Understanding the deeply human reasons behind it? That’s a whole different ball game. Once you’ve crunched the numbers and know who is walking out the door, the real work begins: figuring out why.
High turnover is rarely about a single issue. It’s almost always a symptom of deeper, systemic problems quietly poisoning your company culture. These problems are the real drivers pushing your best people to look elsewhere, often simmering just below the surface until they erupt in a string of two-weeks’ notices.
The Usual Suspects Behind a High Turnover Rate
While every company’s culture is unique, a few key culprits show up time and time again when you dig into why people leave, especially in the hyper-competitive US and Canadian markets. These aren’t just buzzwords; they’re the daily frustrations that slowly chip away at loyalty and drive.
Let’s break down the most common forces wrecking your turnover rate employment figures:
- A Toxic Culture: This is the big one. It’s the number one reason people pack their bags. Toxicity can look like a lot of things: a lack of psychological safety, rampant office politics, zero transparency from the top, or an environment where burnout is worn like a badge of honour. In a US-based remote company, for example, opaque leadership decisions can quickly breed distrust and make everyone feel isolated.
- A Career Dead End: Ambitious people need to see a path forward. If they hit a “glass ceiling” with no clear way to advance or develop new skills, they won’t stick around. They’ll find a company that’s willing to invest in their future. A Canadian scale-up that doesn’t build clear career ladders for its top performers is basically sending them an engraved invitation to leave.
- Bad Management: It’s a cliché for a reason: people don’t leave companies, they leave managers. A boss who micromanages, never gives feedback, or shows zero support for their team’s well-being can single-handedly destroy a department’s morale and send turnover through the roof. This problem is entirely fixable—but only if you know it’s happening.
- Burnout and No Work-Life Balance: An “always-on” culture is a ticking time bomb. When crushing workloads and unreasonable expectations are the norm, even your most committed employees will eventually hit a wall. They’ll seek out an employer who actually respects their personal time and mental health.
By the time these issues pop up on an annual engagement survey, the damage is already done. The feedback you get is a historical record of failure, not a proactive tool you can use to keep your people.
Going Beyond Surveys with Business Intelligence
This is where the limits of traditional HR tools become painfully clear. A yearly survey might tell you that 35% of employees feel stuck, but it won’t tell you which teams are feeling the pain right now. It won’t catch that rising tide of frustration in real-time or give you a shot at stepping in before a key player starts polishing their resume.
A true business intelligence tool like Wurkn offers a completely different way of thinking. It doesn’t wait for a survey window to open. Instead, it acts as an “always-on” listening system, picking up the early warning signs directly from the platforms your teams already live in, like Slack or Microsoft Teams.
Take the current labour market in California, for example. In a state that sees hundreds of thousands of hires and separations every single month, the volatility is immense. Periodic check-ins just don’t cut it. As you can read in this analysis of recruitment challenges in California on Praxt.com, high separation numbers crush productivity, and with replacement costs going through the roof, even a small drop in turnover can save a company millions.
Wurkn takes all that unstructured, anonymous feedback about the big four drivers—culture, growth, management, and burnout—and turns it into a real-time cultural intelligence dashboard. This gives leaders in Canada and the US the power to see the subtle shifts in sentiment as they happen, letting them act decisively before their most valuable people decide it’s time to move on.
The True Business Impact of High Employee Turnover
Understanding your turnover rate employment is one thing, but for a COO, the real story is always on the bottom line. The fallout from high turnover goes way beyond the obvious replacement costs. It triggers a quiet but devastating domino effect across your operations, capable of crippling the business from the inside out.
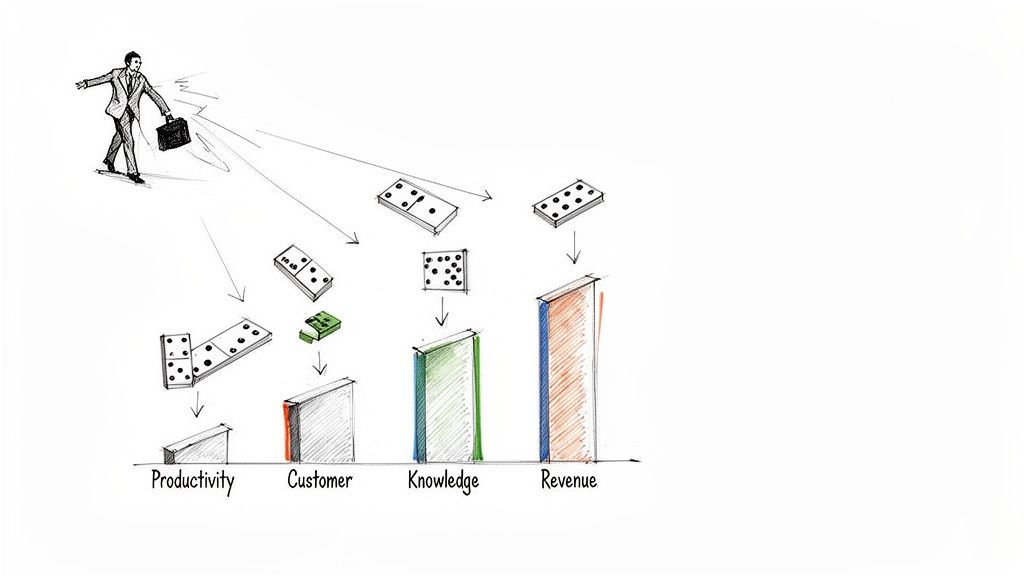
This isn’t just about the money spent on job ads or onboarding. It’s about the silent killers of productivity and profit that creep in when a good employee walks out the door.
Beyond Recruitment: The Cascading Costs
When someone leaves, the most immediate hit is the productivity vacuum they leave behind. The rest of the team is suddenly forced to pick up the slack, leading straight to burnout and a nosedive in morale. This “survivor syndrome” can quickly poison a team’s culture, making others start to wonder if they should be looking, too. It’s a vicious cycle.
Think about a US-based financial services firm that loses a senior manager. Sure, the direct replacement cost might be $150,000—a hefty but manageable number on paper.
But the real damage is hidden beneath the surface:
- Lost Institutional Knowledge: That manager is walking out with years of undocumented processes and deep client relationships. A new hire can’t just absorb that overnight; it creates a knowledge gap that can take months, or even years, to close.
- Damaged Client Relationships: The manager’s departure puts a multi-million dollar client portfolio at risk. Clients who trusted that personal connection are now unsettled and might start looking elsewhere.
- Team Destabilization: The exit creates a wave of uncertainty and overloads the remaining team members. Project deadlines start slipping and service quality drops, directly torpedoing operational efficiency.
Suddenly, that single departure has morphed from a simple HR task into a major business risk that threatens revenue, profitability, and customer loyalty—the core KPIs every COO lives and dies by. The total financial hit is far greater than the initial replacement cost, a point you can explore by understanding the full cost of employee turnover.
From Reactive Surveys to Proactive Intelligence
This is exactly where traditional, once-a-year HR surveys fall flat. They might eventually flag that morale is low, but by then, the damage has been done for months. For a COO, that kind of lagging data is almost useless for making sharp, forward-looking decisions.
A business intelligence tool like Wurkn gives you a strategic advantage by connecting these cultural signals to hard business outcomes in real-time. It doesn’t just tell you morale is low; it acts as an early warning system. By constantly analyzing anonymous feedback from the platforms your teams already use (like Slack or Teams), Wurkn can correlate rising frustration in the client services team with a later dip in customer satisfaction scores. Now you have a leading indicator of churn risk.
The most expensive problems are the ones you don’t see coming. A business intelligence tool makes the invisible visible, connecting the dots between employee sentiment and financial performance before it’s too late.
Even small shifts in the job market can have huge financial consequences. For instance, California’s quit rate recently saw a notable drop, but certain industries there are still battling turnover as high as 25%. When you consider that replacement costs can hit 210% of salary for senior roles, even a tiny reduction in quits can save millions. As a recent Economic Times analysis of US job turnover shows, this volatility proves why you need to keep a constant pulse on your people.
Wurkn’s platform turns this challenge into an opportunity. It shows you not just what is happening but why, empowering COOs to draw a straight line from cultural health to operational efficiency and revenue. It transforms a major business risk into a powerful competitive advantage.
Building a Proactive Employee Retention Strategy
Figuring out why people are leaving is critical, but it’s only half the battle. The real work starts when you build a proactive strategy to stop the leaks before they even begin. This is about moving beyond reactive fixes and creating a system that actually nurtures your talent from day one.
Instead of waiting for exit interviews to tell you what went wrong, a proactive approach focuses on the core pillars of the employee experience. These are the areas where you can make the biggest impact and build a culture where your top performers genuinely want to stay.
From Reactive Fixes to Proactive Solutions
Shifting from a reactive to a proactive model requires a fundamental change in how you listen to your people. Traditional methods like annual surveys are lagging indicators; they tell you about problems long after the damage is done.
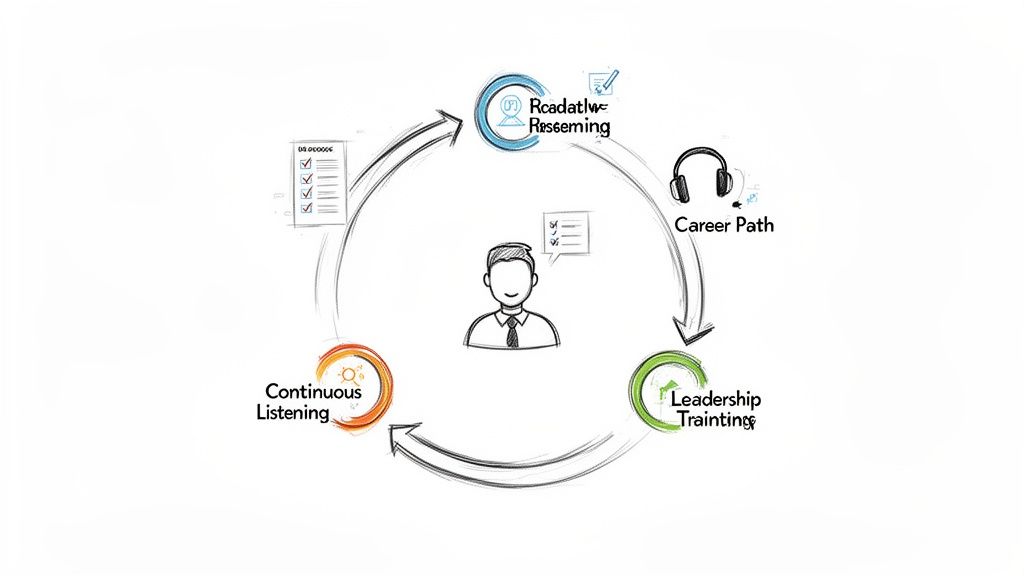
A truly proactive strategy is built on a foundation of continuous listening. You use this real-time insight to strengthen four key areas of your organization.
- Redesign the Onboarding Experience: The first 90 days are a make-or-break period. A clumsy, unstructured onboarding process leaves new hires feeling isolated and confused, making them prime candidates for early turnover.
- Create Clear Career Advancement Paths: Ambitious people won’t stick around if they can’t see a future. A lack of clear, actionable career paths is one of the top reasons high-potential talent starts looking elsewhere.
- Invest in Leadership Training: People leave managers, not companies. This isn’t just a cliché; it’s a reality. Equipping your leaders with the skills to foster psychological safety, give meaningful feedback, and actually support their teams is non-negotiable.
- Foster Psychological Safety: Your employees need to feel safe enough to voice concerns, share ideas, and even make mistakes without fearing punishment. This foundation of trust is the bedrock of both innovation and retention.
A retention strategy based on last year’s survey data is like driving while looking in the rearview mirror. You’ll only see the problems you’ve already passed. Proactive retention requires looking ahead, using real-time data to navigate what’s coming.
The Power of Continuous Cultural Intelligence
This is where a business intelligence tool like Wurkn becomes a game-changer. It elevates your retention efforts from a check-the-box HR exercise to a data-driven operational discipline.
Instead of just suggesting you “improve onboarding,” a platform like Wurkn gives you the real-time feedback loop to actually do it. By anonymously capturing sentiment from new hires on platforms like Slack and Microsoft Teams, it flags integration issues as they’re happening. If a new cohort of engineers is silently struggling with a broken development environment, you’ll know in week two—not six months later in an exit interview.
This “always-on” intelligence lets you connect cultural signals directly to your retention initiatives. You can see how investments in leadership training correlate with improved team sentiment or how clarifying career paths impacts engagement scores in specific departments. It moves your strategy from guesswork to measurable results.
The competitive labour market in places like California highlights why this is so crucial. In 2024, the state saw its voluntary turnover rate drop to 20.1%, a significant improvement. However, this still means that for a 1,000-person company, over 200 employees are walking out the door each year. You can explore more about these trends and their financial impact in this analysis of turnover rates on Nobscot.com.
For People Ops leaders and COOs, a tool like Wurkn helps pinpoint the cultural drivers behind these numbers. It connects anonymous feedback to your KPIs, showing you why your retention efforts are working (or not). This empowers you to make adjustments on the fly, transforming your company culture into a true competitive advantage.
Turning Your Company Culture Into a Competitive Advantage
So far, we’ve walked through everything from calculating your turnover rate employment figures to finding the real reasons your best people are walking out the door. It’s clear that turnover isn’t just an HR line item—it’s a major business challenge that hits your bottom line, hard.
To really get a handle on it, you need to fundamentally change how you think.
The old way of doing things is broken. Annual surveys are basically business autopsies; they tell you why you lost the game long after the final whistle. If you want to win the talent war raging across Canada and the United States, you have to move from guessing to knowing. From lagging indicators to real-time intelligence.
From HR Data to Business Intelligence
This is where you see the massive difference between a simple survey tool and a genuine cultural business intelligence engine. COOs demand real-time, actionable data to manage their finances, supply chains, and operations. Why would you treat your company’s most important asset—its culture—any differently?
A platform like Wurkn delivers exactly that. It takes the conversation way beyond simple engagement scores by providing a continuous stream of actionable intelligence. Wurkn translates the unstructured, anonymous feedback from the platforms your teams use every day into a living dashboard. Suddenly, leaders have the same level of insight into their culture as they do their financials.
In the modern talent war, the companies that win are those that transform employee sentiment from a liability into their greatest strategic asset. Stop guessing why your best people are leaving and start listening.
Turning Sentiment Into Strategy
This constant feedback loop lets you see how cultural signals connect to your most important business KPIs. For the first time, you can draw a straight line from a dip in team morale to a drop in productivity. You can see how a spike in burnout directly correlates with an increase in customer support tickets.
This isn’t just about making people feel good; it’s about making smarter, data-driven decisions that protect revenue, improve operational efficiency, and build a more resilient organization. When you understand the ‘why’ behind the numbers in real-time, you can step in before small issues snowball into costly turnover. To take the next step on this journey, explore our practical guide on how to improve company culture.
Ultimately, your culture is either a powerful competitive advantage or a serious operational risk. By harnessing the power of cultural business intelligence, you empower your People Ops and operational leaders to stop plugging leaks and start building a stronger, retention-focused foundation for growth.
Still Have Questions? We’ve Got Answers.
Here are a few of the most common questions that pop up when we talk to COOs and People Ops leaders about turnover.
What Is a Good Turnover Rate for Employment?
Honestly, there’s no magic number. A “good” turnover rate is entirely dependent on your industry. A tech company might celebrate a 10-15% annual turnover rate, while retailers and restaurants in Canada and the US often battle rates north of 50%.
The best approach isn’t to chase a universal benchmark. Instead, measure yourself against your specific industry and, more importantly, against your own historical trends.
A “good” turnover rate is one that’s either stable or—even better—trending downward. The real red flag is a rising rate among your A-players. If you start losing top performers, your rate is too high, no matter what the industry average says.
How Is Continuous Feedback Different from an Annual Survey?
Think of it this way: an annual survey is like an autopsy. It’s a lagging indicator that tells you what went wrong months after the fact. By the time you get the results, the damage is done, and your best people might already be gone.
Continuous cultural intelligence, on the other hand, gives you leading indicators. It’s like having a real-time health monitor for your organization, giving you a constant pulse on how things are really going.
This modern approach flips the script from a reactive yearly review to a proactive, ongoing conversation. A business intelligence tool like Wurkn taps into anonymous sentiment where your teams already are—like Slack or Microsoft Teams—so you can spot friction and fix it before it turns into another resignation.
Can We Link Cultural Data to Financial Performance?
Absolutely. In fact, if you can’t, you’re not using a true business intelligence tool. This is precisely what separates a simple HR survey platform from an operational asset. It’s all about connecting how people feel to how the business performs.
When you can analyze themes from anonymous feedback—like the sales team’s frustration with a new process or burnout signals from engineering—and lay that data over your operational metrics, the connection becomes crystal clear.
For example, a business intelligence tool can draw a direct line from a spike in negative sentiment on the customer success team to a dip in client retention rates two months later. That’s the kind of insight that lets a COO make a strategic call that protects the bottom line, turning “culture” from a vague concept into a measurable driver of financial health.
Ready to stop guessing why people leave and start getting real-time, actionable intelligence? With Wurkn, you can connect culture directly to your business results and build a more resilient, profitable organization. See how Wurkn turns sentiment into a strategic asset.