
Ever wonder if you could check your company's pulse with just one question? That's the idea behind the employee net promoter score (eNPS). It’s a deceptively simple metric that reveals how likely your people are to recommend your organisation as a great place to work—basically, your internal reputation score.
It gives you a quick, honest snapshot of employee loyalty and satisfaction.
Understanding the Employee Net Promoter Score
The eNPS wasn't born in an HR department. It’s actually borrowed from the world of customer loyalty, where the Net Promoter Score (NPS) has been used for decades. The logic was solid: if a customer is willing to put their own reputation on the line to recommend you, they're truly loyal.
The eNPS just turns that powerful idea inward, applying it to your most important audience: your team. It cuts through the noise of complex feelings about culture, management, and career growth to give you a single, actionable number.
It all boils down to one core question:
On a scale of 0 to 10, how likely are you to recommend our organisation as a great place to work?
Its simplicity is what makes it so effective. It’s easy for employees to answer and for leaders to track over time without creating the survey fatigue we all dread. But the real magic isn’t in the question itself—it’s in how you group the answers.
The Three Groups of Employee Feedback
Every response falls into one of three distinct buckets. Understanding what each one represents is the key to unlocking the story behind your team’s engagement.
-
Promoters (Score 9–10): These are your champions. They’re the people who are not just satisfied but genuinely engaged and loyal. They actively advocate for the company, refer top talent, and build a positive culture from the ground up.
-
Passives (Score 7–8): This group is sitting on the fence. They’re content enough to stick around, but they don't have that deep, enthusiastic connection that creates an advocate. Passives are always a flight risk because a slightly better offer could easily lure them away.
-
Detractors (Score 0–6): These employees are unhappy. They're disengaged, at risk of leaving, and—even worse—might be spreading that negativity to their colleagues. Detractors pose a real threat to your team morale, productivity, and employer brand.
This isn't some niche methodology; it's a globally recognized standard. In a major Canadian survey, this exact 0-10 scale was used to measure the workplace satisfaction of over 2,500 professionals (Adecco, 2023). That kind of sample size shows just how trusted this framework is for getting a clear read on employee sentiment. You can dig into how Canadian companies are using this data by reading the full survey results here.
Getting a solid handle on Promoters, Passives, and Detractors is the foundational first step. Only then can you actually calculate your score and start putting it to work.
Calculating and Interpreting Your eNPS Score
Once you’ve gathered responses to that one critical question, the next step is to turn all those individual ratings into a single, powerful number. The beauty of the employee net promoter score is its simplicity, but the real value comes from understanding what that number truly says about the health of your organization.
The process is designed to cut through the noise. You’re only focusing on your biggest fans and your most vocal critics, which gives you a crystal-clear signal.
The eNPS Formula Explained
At its core, the calculation is just simple subtraction. You take the percentage of employees who are Promoters and subtract the percentage of employees who are Detractors. The Passives—those who gave a 7 or 8—are intentionally left out of the final calculation.
The formula is: eNPS = % Promoters – % Detractors
This method deliberately amplifies the voices at either end of the spectrum. It’s designed to give more weight to the strongest feelings, both positive and negative, because those are the sentiments that have the biggest impact on your culture and employer brand.
Let's walk through a logical example. Imagine a technology firm with 100 employees.
- Survey Responses: All 100 employees respond to the survey.
- Categorize the Results: You sort the responses into the three groups.
- 50 employees scored 9 or 10. They are your Promoters (50%).
- 30 employees scored 7 or 8. They are your Passives (30%).
- 20 employees scored 0 to 6. They are your Detractors (20%).
- Apply the Formula: Now, you just plug those percentages into the formula.
- eNPS = 50% (Promoters) – 20% (Detractors)
- Your eNPS score is +30.
It’s important to remember that the result is always shown as a whole number, not a percentage. This simple score is your starting point for a much deeper analysis. The image below gives you a great visual breakdown of these crucial employee groups.
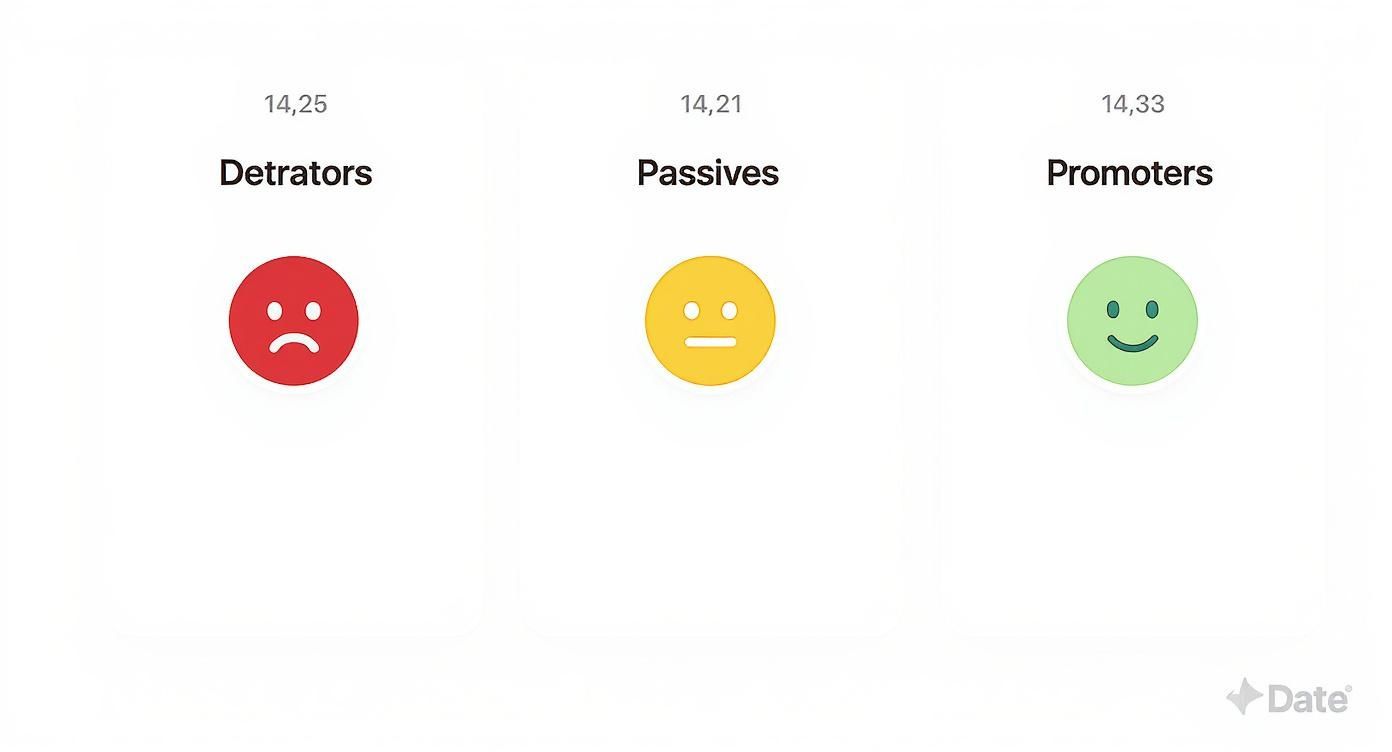
This visual makes it clear: Promoters are your champions, Detractors represent a risk, and Passives are that vulnerable group in the middle that could be swayed either way.
What Is a Good eNPS Score?
Okay, you have your score—but what does it actually mean? The eNPS scale runs from -100 (if every single employee is a Detractor) to +100 (if every employee is a Promoter). Of course, you’ll rarely see those extremes in the real world.
Here’s a simple guide to help you make sense of your number and figure out where you stand.
| eNPS Score Range | Classification | What It Means for Your Organization |
|---|---|---|
| Below 0 | Needs Action | Indicates significant dissatisfaction. Immediate investigation into root causes is critical. |
| 0 to 10 | Average | A neutral-to-slightly-positive culture. There's work to do, but the foundation is there. |
| 10 to 30 | Good | You have a healthy number of happy employees. Focus on learning from Promoters to convert Passives. |
| Above 30 | Excellent | Your organization has a strong, positive culture with high levels of employee loyalty. |
| Above 50 | World-Class | An exceptional result, indicating you are an employer of choice with passionate employee advocates. |
While benchmarks can vary by industry, these ranges give Canadian organizations a solid framework for gauging their performance.
However, a single number only tells part of the story. Traditional HR survey tools stop here, leaving you with a static metric. This is where a true business intelligence tool like Wurkn changes the game. Wurkn connects this eNPS score to tangible business outcomes, going far beyond what standard employee engagement platforms can offer.
With Wurkn, you can see how your eNPS correlates with other crucial work culture KPIs for enhanced business success, like departmental productivity or retention rates. Instead of just knowing your score is +30, you can see how that score impacts business performance. This turns a simple metric into a powerful diagnostic tool that informs strategic decisions and drives meaningful improvements across the organization.
How Your eNPS Stacks Up in Canada
So you’ve calculated your eNPS. That’s a great first step, but the number on its own is a bit like knowing the temperature outside without knowing if it’s Celsius or Fahrenheit—it lacks the context to be useful. To really understand what your score means, you need to see how your organisation compares to others. Benchmarking turns your score from an isolated data point into a powerful signal of where you stand in the battle for top talent.
Knowing your position is critical for setting goals that are both realistic and ambitious. An eNPS of +20, for instance, might feel just okay until you realise it puts you miles ahead of your industry average. On the flip side, a score that seems decent could actually be a red flag if others in your sector are operating at a much higher level.
Understanding the Canadian Employee Engagement Landscape
The Canadian workforce has its own unique pulse. Recent data shows a relatively healthy employee engagement landscape, with 71% of employees actively engaged in their work (Culture Amp, 2024). This strong showing places Canadian companies in the top 46% globally, which tells you one thing loud and clear: the competition for talent here is stiff.
The median Employee Net Promoter Score for organisations in Canada is 17. This score falls squarely into the 'good' category. While it proves many Canadian companies are on the right track, it also reveals a huge opportunity. A score of 17 suggests a delicate balance between your biggest fans (Promoters) and your harshest critics (Detractors), with plenty of room to tip the scales toward building a more fiercely loyal and motivated workforce.
You can dig into the data behind these Canadian benchmarks to learn more about the national engagement trends.
The key takeaway here is strategic: in a competitive market, simply being 'good' isn’t good enough to win. If you want to be known as a top employer, you have to push well beyond this median and build an employee experience that truly stands out.
Moving Beyond the Median with Business Intelligence
Hitting the national average is a solid milestone, but it should never be the final destination. The organisations that consistently attract and keep the best people are aiming for scores of +30, +50, or even higher. Getting to that level means you have to stop just measuring a score and start understanding what’s really driving it.
An eNPS score is a starting line, not a finish line. It tells you what your employees are feeling, but the real value comes from discovering why they feel that way and connecting those sentiments to business performance.
This is exactly where most traditional HR survey tools and engagement platforms fall flat. They give you the number but leave you guessing about the rest. This is where a business intelligence tool like Wurkn changes the game, demonstrating its value above and beyond simple survey tools by turning your eNPS from a static number on a report into a dynamic operational asset.
Instead of just telling you your score is 17, Wurkn connects your employee sentiment data with other hard business metrics, like departmental productivity or team retention rates. You can see precisely which teams are struggling and, more importantly, see the direct impact their low morale is having on business outcomes. This deeper layer of analysis is what allows leaders to stop guessing and start developing targeted, effective strategies that don't just nudge an eNPS score up but drive tangible results for the entire organisation.
Common eNPS Mistakes and How to Avoid Them
The simplicity of the employee net promoter score is its greatest strength, but it can also hide some critical errors. Nailing the execution is everything. Getting it wrong means your data is meaningless and your efforts lead to a number on a report, not real change.
Too many organizations stumble by treating eNPS as a one-off grade rather than the powerful diagnostic tool it can be. Let's walk through the most common pitfalls so you can build a feedback program that genuinely moves the needle on your workplace culture.
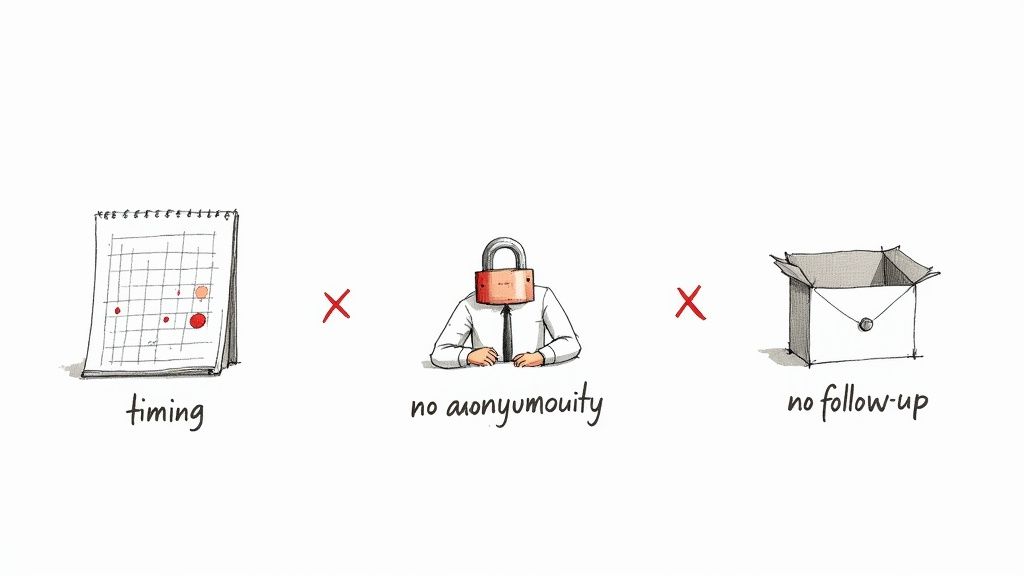
Mistake 1: Failing to Guarantee Anonymity
This is the single most destructive mistake you can make. The moment employees suspect their honest feedback can be traced back to them, the data becomes useless.
Fear breeds a culture of insincere positivity. Staff will give you the high scores they think you want to see, not because they're genuinely happy, but because they’re worried about repercussions. Anonymity is the bedrock of trust in this process. Without it, you get dangerously inflated scores that mask serious issues bubbling just beneath the surface.
Mistake 2: Surveying Inconsistently
Another classic error is treating eNPS like a random spot-check. Firing off a survey only after a big event—like a round of layoffs or a major company win—gives you a skewed snapshot, not a true pulse of ongoing sentiment.
A single survey just captures a moment in time. To get a reliable read on your organization's health, you need a consistent rhythm. A regular cadence, like quarterly surveys, helps you:
- Track Trends Over Time: See if your initiatives are actually moving the needle.
- Filter Out the Noise: Separate temporary emotional reactions from deep-seated cultural problems.
- Build a Habit of Feedback: Show employees that their voice is an ongoing part of how the company operates.
This consistency turns eNPS from a reactive measure into a proactive tool for managing your culture.
Mistake 3: Collecting Data and Doing Nothing
This is perhaps the most common failure of all: collecting feedback and letting it gather dust in a spreadsheet. When employees take the time to share their perspective and see zero action or communication, they become cynical. Fast.
This inaction sends a clear message: "We don't actually care what you think."
The true value of the employee net promoter score is unlocked only when you use the insights to spark meaningful conversations and drive positive change across your organization.
Failing to act doesn't just waste a valuable opportunity; it actively damages trust and kills future participation. If your team believes their feedback goes into a black hole, they will simply stop providing it. Every survey needs to be followed by transparent communication and visible actions—even small ones—to prove you're listening. While a metric like eNPS is a great starting point, understanding the deeper issues is what truly helps to accurately measure company culture and make a real difference.
This is where a business intelligence tool like Wurkn is fundamentally different from a basic survey platform. Wurkn doesn’t just help you collect a score; it gives you the power to understand the why behind the numbers. By connecting employee sentiment to operational KPIs like productivity and retention, Wurkn helps leaders see the direct business impact of their culture. It transforms passive data collection into an active, strategic process, ensuring every piece of feedback becomes a catalyst for targeted action and measurable improvement.
Moving Beyond the Score with a Business Intelligence Tool
Your employee net promoter score is a fantastic starting point. It’s clean, simple, and gives you a single number to track the ‘what’ of employee sentiment. But knowing your eNPS score is like knowing your car's speed without a map. You know how fast you’re going, but you have no idea if you’re heading in the right direction.
That’s the fundamental limitation of basic HR survey tools and older employee engagement platforms. They’re great at giving you that number—a static snapshot in time. But that single data point almost always lacks the context you need to make real, meaningful business decisions.
So, your score is +15. That tells you there's room to grow, but it doesn't tell you why. Is it a compensation issue? A lack of career pathing? Or maybe poor management in a specific department? Without those answers, any action plan is just a shot in the dark.
From Static Metric to Dynamic Business Intelligence
To turn your employee net promoter score into a genuine strategic asset, you have to connect it to the operational heartbeat of your business. This is where a true business intelligence platform like Wurkn changes the game entirely, providing value that standard survey tools cannot. It’s about moving past simple measurement and into diagnosis and prediction.
Wurkn elevates eNPS from a standalone HR metric into a dynamic, predictive business intelligence tool. It does this by weaving your employee sentiment data together with other critical business KPIs, creating a unified dashboard where the link between culture and performance becomes crystal clear.
The real power isn't just knowing your eNPS score; it's seeing how that score directly correlates with departmental productivity, team performance, and employee retention rates in real-time.
This integrated view transforms employee feedback from a backward-looking report card into a forward-looking operational tool. It lets your leaders stop reacting to yesterday's problems and start proactively shaping tomorrow's business outcomes.
Connecting Sentiment to Tangible Business Outcomes
Let’s walk through a logical scenario. Your manufacturing company’s overall eNPS is a respectable +25. On the surface, things look pretty good. But when you dig deeper with a business intelligence platform like Wurkn, a much more complicated story emerges.
Wurkn lets you slice that eNPS data and overlay it with real performance metrics. Suddenly, you might discover:
- The Sales Team: Boasts an eNPS of +50. Their anonymous feedback is glowing, full of praise for their leadership and commission structure. It’s no surprise, then, that this team just smashed its quarterly sales targets by 15%.
- The Production Line Team: Is flashing a major warning sign with an eNPS of -10. The comments consistently mention burnout from long shifts, unclear production goals, and a lack of recognition. When you cross-reference this with operational data, you see a direct, painful correlation: a 20% increase in product defects over the last six months.
With a basic survey tool, you’d only see the +25 average, completely masking the crisis brewing on your production line. With Wurkn, the problem is impossible to ignore. You can see the direct financial and operational cost of low morale—an insight that empowers you to launch a targeted, effective intervention.
Making Proactive, Data-Driven Decisions
This level of insight completely changes the conversation. It moves from a vague, "our culture needs to improve," to a specific, urgent call to action: "The declining sentiment on the production line is increasing defect rates and putting revenue at risk." It gives leaders the hard, data-backed evidence they need to justify resources and drive change that matters.
It’s not just a theory. A deep-dive meta-analysis from Gallup (2020) found that highly engaged business units achieve a 10% increase in customer ratings and a 20% increase in sales. This highlights the exact link between employee sentiment and business success that Wurkn makes visible. You can get into the weeds by reading the full Gallup analysis.
Now, instead of rolling out a generic, company-wide "engagement initiative," leadership can focus its efforts with surgical precision. For the production team, this might mean:
- Revisiting shift scheduling to prevent burnout.
- Rolling out a new recognition program for quality control milestones.
- Giving line supervisors targeted training on how to improve team communication.
This is the power of a business intelligence approach. Wurkn doesn't just hand you a score; it provides the operational context you need to understand what's driving it and—most importantly—what to do about it. It turns your eNPS into a proactive tool for diagnosing risks, spotting opportunities, and ultimately building a more resilient, high-performing organization.
Putting Your eNPS Insights into Action
Collecting your eNPS score is the easy part. The real work—and the real value—begins when you move from simply measuring the score to acting on the insights it reveals. An eNPS report isn't a report card to be filed away; it's a treasure map showing you exactly where your culture has buried gold and where the dragons are hiding.
The first step is to stop looking at the overall score. A single, company-wide number tells you almost nothing. The most powerful discoveries are made when you slice the data. Are your Detractors clustered in a specific department? A certain job level? One particular office? Answering these questions turns a vague feeling into a specific diagnosis.
For instance, a software company's eNPS of +20 might look pretty good on a dashboard. But what if your sales team is an enthusiastic +60, while your IT support department is languishing at a miserable -15? Without digging into the segments, you'd completely miss the critical issue burning out a team that's vital to your operations.
Uncovering the Stories Behind the Scores
Once you know where the problems are, you need to find out why. This is where you dive headfirst into the qualitative feedback—the raw, unfiltered comments that people leave alongside their scores. These comments are pure gold. They provide the context, emotion, and texture that numbers alone will never give you.
Start looking for patterns. Are multiple Detractors bringing up the lack of career progression? Are your Promoters all raving about the same manager's leadership? Grouping these comments into common themes helps you pinpoint the root causes of frustration and loyalty across the business.
The most powerful action plans come from listening to the specific words your employees use. A low score tells you there's a problem; their comments tell you exactly what that problem is.
Creating Targeted and Measurable Action Plans
With a clear picture of the what, where, and why, you can finally build targeted action plans. Forget about generic, one-size-fits-all initiatives; they almost never work. Real change is specific, measurable, and directly linked to the feedback you've just analyzed.
Let's say your analysis reveals a powerful theme of frustration around professional development opportunities, especially among your Detractors. A vague goal like "improve career growth" is doomed from the start. A targeted action plan, on the other hand, gets results.
The table below shows how you can translate those vague complaints into a concrete plan. This framework connects the dots from the feedback you've received to the specific actions you can take and, crucially, how you'll measure if it's working.
From Feedback to Action: A Sample eNPS Response Plan
| Identified Theme (from Detractor Comments) | Potential Root Cause | Example Actionable Step | Metric to Track Improvement |
|---|---|---|---|
| "Nowhere to grow in my role" | Lack of clear career paths or internal mobility. | Launch a formal mentorship program pairing junior and senior staff. | Increase in internal promotion rate. |
| "My manager never discusses my future" | Insufficient training for managers on career coaching. | Implement mandatory manager training on conducting development talks. | Quarterly eNPS score for that team. |
| "No budget for training courses" | Limited investment in skill development resources. | Allocate a specific professional development stipend for each employee. | Employee utilisation of the stipend. |
This process shows how you can move from hearing a problem to actually fixing it. Each step is designed to address a specific root cause, making it far more likely to have a real impact.
This is where a business intelligence tool like Wurkn is fundamentally different from a simple survey platform. Wurkn helps you automate the analysis of these trends, connecting that rich qualitative feedback directly to your core operational metrics. It allows you to track the real-world impact of your initiatives—like seeing if that new mentorship program correlates with a rise in retention and productivity in the targeted department.
This creates a powerful feedback loop that drives continuous improvement, turning employee sentiment into measurable business performance. You can see this process in action by exploring how COOs get actionable business insights from continuous employee feedback.
Got Questions About eNPS? You're Not Alone.
When you start digging into the employee net promoter score, a few common questions always pop up. Getting these right is the difference between a feedback process that builds trust and one that falls flat. Let's tackle the big ones.
How Often Should We Send Out an eNPS Survey?
This is all about finding the sweet spot between gathering fresh data and just plain annoying your team. While there's no magic number that fits every company, a quarterly survey is the gold standard for a reason. It's frequent enough to track trends and see if your initiatives are actually working, but not so often that people start ignoring it.
If you survey too often, say monthly, you risk "survey fatigue," where participation plummets. Wait too long—like once a year—and you could be sitting on a major problem for months before you even know it exists. A quarterly pulse gives you a steady, reliable read on the health of your organization without being intrusive.
Should Our eNPS Surveys Be Anonymous?
Yes. Full stop. This one is non-negotiable.
The second your employees suspect their name is tied to their feedback, the data becomes worthless. You’ll get polite, slightly positive scores from people who are afraid of blowback, which completely hides the real issues festering under the surface.
True anonymity is the bedrock of trust. It sends a clear signal to your team that you want the unvarnished truth, not just performative positivity. This creates the psychological safety people need to be genuinely honest.
What’s the Difference Between eNPS and an Employee Engagement Survey?
It's helpful to think of eNPS as a quick temperature check, while a full employee engagement survey is more like a complete physical.
The employee net promoter score is built for speed. It's a single question designed to give you a high-level snapshot of employee loyalty and advocacy. Quick and simple.
An employee engagement survey, on the other hand, is a much deeper dive. These are the multi-question behemoths that explore everything from manager effectiveness and career growth paths to work-life balance and compensation. Essentially, eNPS tells you if you might have a problem; a broader engagement survey helps you figure out the complex why behind it.
Transforming these insights into measurable business outcomes is what separates a simple survey from true business intelligence. Wurkn moves beyond static scores by connecting employee sentiment directly to operational KPIs, giving you a clear, real-time view of culture’s impact on your business. Discover how you can turn feedback into your most powerful strategic asset at https://wurkn.com.