
The Average Is Lying to You. And Your Culture Decisions Are Running on It.
In September, the ADP Research Employee Motivation and Commitment Index rose for the first time in five months, climbing one point to 127. Headline numbers love that. “Employee sentiment improved.” “Workers are getting more engaged.”
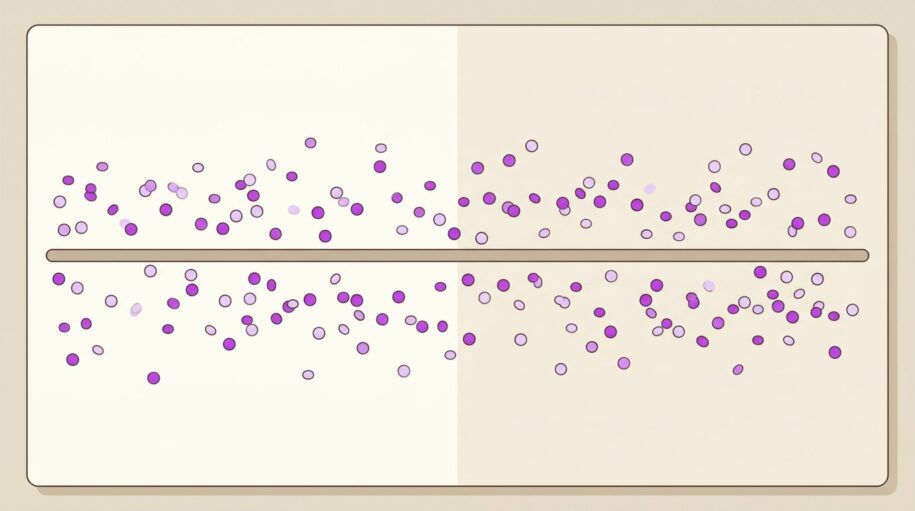
Here is what the headline hid. Ten of the nineteen industries ADP tracks fell. Real estate dropped twenty-five points, the biggest decrease of any sector, to 84. Construction dipped. Retail softened. The overall number went up because a few sectors carried it, and the index averaged the rest into invisibility.
One number described nobody.
Why Averages Hide What You Actually Need
The average is the enemy of action. It collapses an entire organization into a single figure and then invites leadership to make decisions against that figure as if it meant something.
Think about what an average actually is. It is the arithmetic midpoint of every individual score in your organization, which means it is wrong for almost every team in it. The department quietly disconnecting pulls it down. The high-performing team with great morale pulls it up. The average lands somewhere in the middle and tells you precisely nothing about either one. It is the same gap that made the annual survey obsolete: one number, once a year, describing a workforce that changes every week.
When real estate fell twenty-five points in a month, an executive watching only the index saw “motivation improved.” The teams that were actually struggling got no signal at all. The index was not wrong. It was just useless for the only question that matters: where, specifically, is culture breaking.
The Distribution Is the Signal
What leadership actually needs is not the average. It is the distribution.
Which teams are disconnecting and how fast? Which departments are approaching burnout and at what meeting-load threshold? Where is collaboration density dropping, and is it a blip or a trajectory? These are the questions an aggregate number cannot answer and a distribution can.
This is the difference between knowing your culture is healthy on average and knowing which specific team is about to fracture. One is a report you file. The other is a decision you make.
How Real-Time Telemetry Reads the Distribution
Organizational telemetry does not compute an average and stop. It reads the underlying variation.
It tracks collaboration density between teams and flags when cross-functional communication goes quiet. It monitors meeting load distribution and surfaces when a department crosses the threshold where burnout becomes a trajectory. It follows communication health and detects sentiment shifts over consecutive weeks before they become resignations.
Every one of those is a distribution read, not a headline number. When one team starts disconnecting, you see the team. When one department approaches burnout, you see the department. The aggregate may say “healthy.” The distribution says otherwise.
The architecture matters here as much as the insight. Wurkn anonymizes at the collection layer, so leadership sees organizational patterns without individual surveillance. No one is watching what any one person types. The signal is about how the whole organization is moving, and the variation within it.
What Leaders Should Do Differently
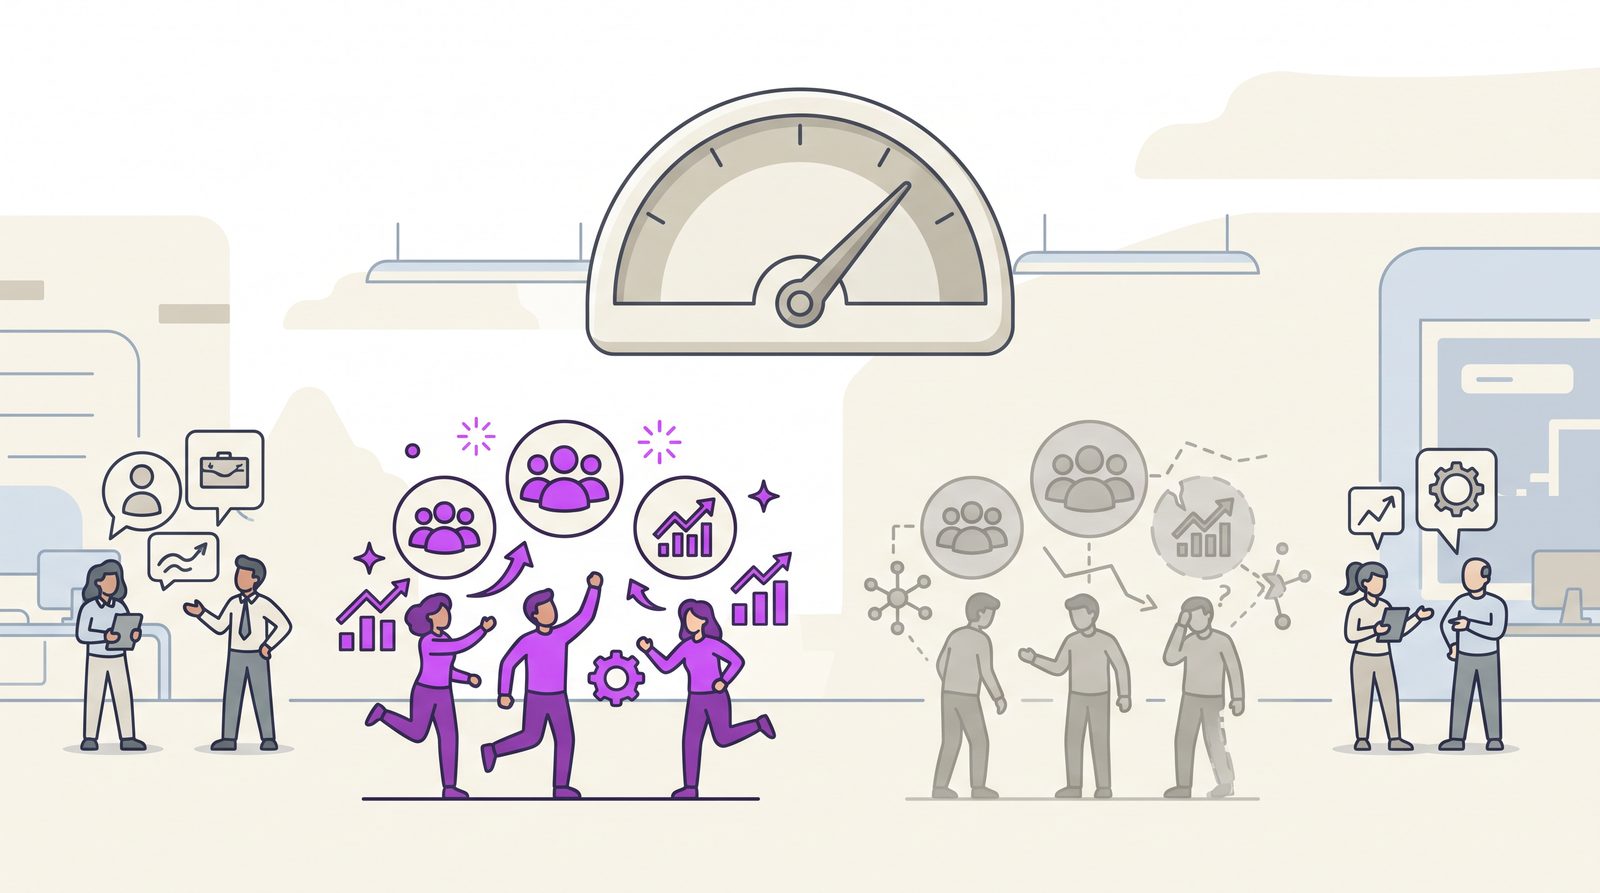
Stop managing to the average. It is a decision tool that is wrong for every team it claims to describe.
Start asking what the distribution looks like. Which teams are diverging from the trend, in either direction? What is the spread, and what does the shape of it predict? A culture decision informed by a distribution is a decision made with the information that actually exists. The same discipline applies to the other culture decisions already on your desk: RTO mandates belong on measurement, not vibes.
The organizations with the shortest signal-to-decision latency move faster. The ones that read the distribution instead of the average are the ones that catch a fracture while it is still a leading indicator, not a post-mortem.
Wurkn puts a live culture distribution on the same shelf as your revenue dashboard, your margin line, your churn curve. Measure where culture is actually moving, and you can manage it before it becomes a problem.
Wurkn is accepting pilot partners. Learn more at wurkn.com.
Frequently Asked Questions
What does the ADP motivation index actually measure?
The ADP Research Employee Motivation and Commitment Index tracks how US workers think and feel about their jobs. In September 2026 it rose one point to 127, its first improvement in five months, while ten of nineteen industries fell.
Why is the average engagement number misleading?
The average collapses every team into one figure, which is wrong for almost every team it describes. A department in decline and a high-performing team can cancel each other out, leaving a headline number that tells leadership nothing about either.
What is the difference between an average and a distribution?
An average is one aggregate midpoint. A distribution shows the full variation, which teams are diverging, in which direction, and how fast. Leadership can act on a distribution because it reveals where culture is actually breaking.
How does Wurkn read the distribution rather than the average?
Wurkn tracks collaboration density, meeting load, and communication health at the team level, anonymized at the collection layer. It surfaces which teams are disconnecting and how fast, so leaders see the variation the headline hides.
Leave a Reply