
Pressure to deliver measurable results grows every quarter at most technology companies. For people operations managers, the real challenge is separating surface numbers from metrics that actually measure value. Productivity is not just about counting hours or outputs. It’s about understanding how your teams function, why performance shifts, and what signals success or trouble ahead. This article helps you pinpoint exactly what employee productivity metrics measure and how real-time feedback transforms those numbers into smarter action.
Table of Contents
- What Employee Productivity Metrics Measure
- Key Categories and Common Metric Types
- Integrating Real-Time Feedback and Analytics
- Linking Metrics to Retention and Revenue
- Common Pitfalls and Ethical Considerations
Key Takeaways
| Point | Details |
|---|---|
| Understanding Productivity Metrics | Productivity metrics measure how effectively time, effort, and resources are transformed into value. Focus on metrics that reveal actual outcomes instead of vanity metrics. |
| Cultural Factors Matter | To improve productivity, organisations must understand the cultural and environmental contexts that influence employee performance. Engagement signals provide crucial insights. |
| Real-Time Feedback Integration | Combining real-time feedback with productivity metrics allows for proactive management of productivity issues before they escalate. Continuous insight helps identify root causes and influences decisions. |
| Ethical Measurement Practices | Ensure transparency and employee involvement in the design of metrics to maintain trust. Ethical considerations in measuring productivity are critical to avoid biases that could affect performance assessments. |
What Employee Productivity Metrics Measure
Employee productivity metrics track how effectively your team converts inputs—time, effort, and resources—into tangible outputs and business results. At their core, these metrics answer a straightforward question: Are your people producing value?
Unlike vanity metrics that look good on dashboards but tell you nothing, real productivity metrics reveal the actual work happening across your organization. They move beyond surface-level activity tracking to capture outcomes that matter to your business.
Core Elements Productivity Metrics Capture
When you measure employee productivity, you’re typically examining three fundamental dimensions:
- Output quality and volume: What are people actually producing, and does it meet standards?
- Efficiency: How many resources does it take to create that output?
- Time allocation: Where are employees spending their hours, and are those hours generating value?
Efficiency by which inputs convert to outputs directly influences your bottom line. When your team transforms effort into measurable results, productivity improves.
But here’s what most organisations miss: productivity doesn’t exist in a vacuum. It’s deeply connected to how people actually feel about their work, their managers, and their role in the company.
Why This Matters for Your Business
You already know that productivity drives profitability. What you may not realize is that the strongest productivity insights come from understanding the cultural and environmental factors that enable—or block—good work.
When you measure productivity through engagement signals that reveal what’s actually happening in your culture, you gain visibility into why productivity fluctuates. You see the relationship between team morale, workload, management effectiveness, and actual output.
This context transforms productivity data from historical reporting into forward-looking intelligence.
What Makes a Productivity Metric Actually Work
Not all productivity metrics are created equal. The ones that drive real business decisions share these characteristics:
- Directly tied to business outcomes: The metric connects to revenue, customer satisfaction, or operational goals
- Measurable without disruption: You capture data where work actually happens, not through intrusive tracking
- Actionable and specific: You can identify what changed and why
- Real-time or near real-time: You respond to trends before they become problems
When productivity metrics live in isolated spreadsheets updated monthly, they’re too slow to inform decisions. Modern organisations need metrics that reflect what’s happening now, with the context needed to understand root causes.
The most valuable productivity metrics don’t just show you what happened—they reveal why it happened and what to do about it.
The Productivity-Culture Connection
You’ve probably experienced this: two teams with identical resources and responsibilities produce vastly different results. The difference isn’t usually capability—it’s how the team functions together.
Productivity metrics that ignore culture miss half the picture. When you layer in real-time feedback about workload, autonomy, psychological safety, and management quality, your productivity numbers become predictive.
You can actually see why productivity is dropping before revenue reports show the damage.
Pro tip: Start by identifying which metrics directly connect to your business outcomes, then work backwards to understand the cultural and operational factors that influence them. This approach turns productivity data into strategic advantage.
Key Categories and Common Metric Types
Productivity metrics fall into distinct categories, each designed to measure different aspects of work performance. Understanding these categories helps you select the right metrics for your organisation’s specific needs and industry context.
The most effective organisations don’t rely on a single metric—they use a combination that together paint a complete picture of performance.
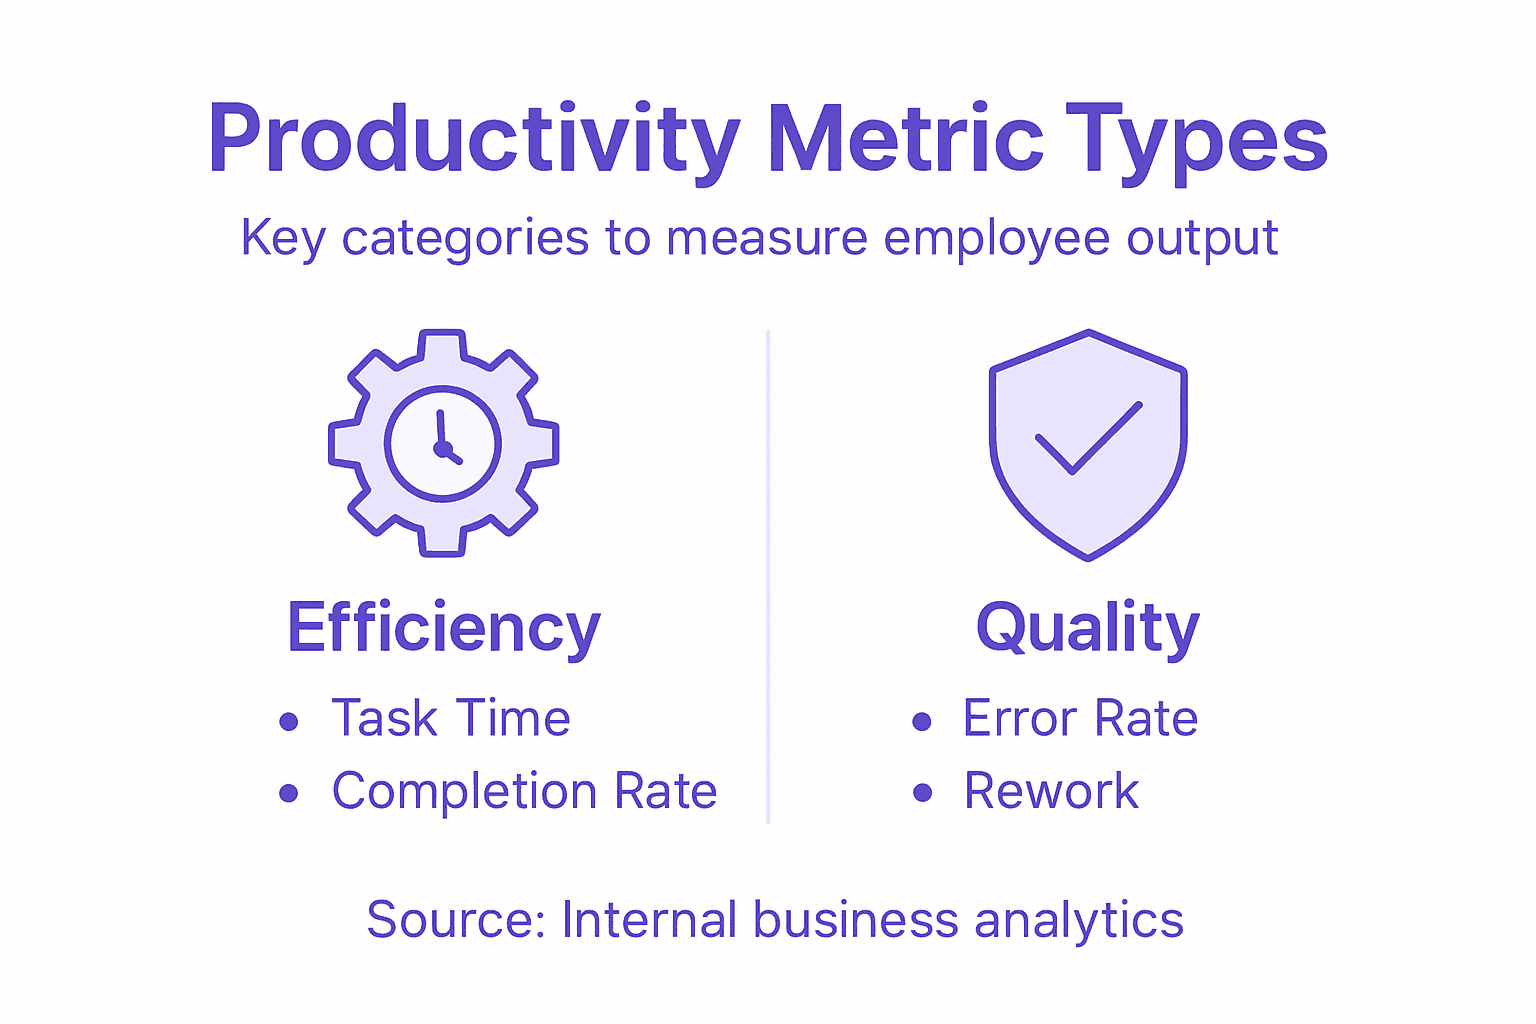
Time-Based and Output Metrics
Time-based metrics like task completion rates track how long work takes from start to finish. These reveal workflow bottlenecks and whether people have realistic timelines for their responsibilities.
Output-based metrics measure what actually gets produced. This might be units manufactured, projects completed, or code deployed—whatever represents completed work in your industry.
Both matter, but separately. Someone could complete tasks quickly while producing poor quality, or take longer while creating exceptional output.
Quality and Behavioural Metrics
Quality metrics examine accuracy, error rates, and rework needs. A customer service representative handling 100 calls daily creates no value if half require callbacks.

Behavioural metrics track attendance, timeliness, and engagement patterns. These reveal whether people show up ready to work and how invested they are in their roles.
These four categories work together. You need speed without sacrificing quality. You need people engaged and present.
To clarify differences among productivity metric categories, here is a summary table:
| Metric Category | What It Measures | Best Used For |
|---|---|---|
| Time-based | Task duration, time to complete | Revealing workflow bottlenecks |
| Output-based | Units produced, projects done | Assessing quantity of results |
| Quality | Error rates, rework levels | Monitoring output standards |
| Behavioural | Attendance, engagement | Gauging commitment, reliability |
Industry-Specific Metrics That Matter
Different roles demand different measurements:
- Sales teams: Conversion rates, deal size, sales cycle length, quota attainment
- Customer service: Response time, resolution rate, customer satisfaction scores, first-contact resolution
- Software development: Code quality, deployment frequency, bug escape rate, sprint velocity
- Remote teams: Task completion within agreed timeframes, meeting attendance, asynchronous collaboration quality
Your technology company likely uses several of these depending on function. What matters is that metrics align with actual job responsibilities.
The best metrics are role-specific and tied directly to what success looks like in that position.
Organisation-Wide Metrics
Some metrics roll up across your entire organisation. Revenue per employee shows overall organisational productivity and efficiency at scale.
Other organisation-wide indicators include project completion rate, employee utilisation, and cost per output unit.
These high-level metrics tell you if productivity is trending up or down, but they won’t tell you why. That requires combining organisation-wide data with team and individual metrics to spot patterns.
Pro tip: Start with organisation-wide metrics to identify where productivity is declining, then drill down into team and individual metrics to understand root causes. This top-down approach saves time and targets intervention where it matters most.
Integrating Real-Time Feedback and Analytics
Productivity metrics only work when you combine them with continuous insight into why performance changes. Static annual reviews and monthly reports miss the patterns that matter—the real shifts happening week to week.
Real-time feedback tied to analytics transforms productivity data from historical record into forward-looking intelligence. You see problems before they become severe.
This table compares real-time feedback with traditional reporting for productivity insights:
| Aspect | Real-Time Feedback | Traditional Reporting |
|---|---|---|
| Speed of Insights | Immediate | Delayed (months) |
| Ability to Intervene | Issues caught early | Issues escalate before action |
| Impact on Culture | Drives accountability | Can miss hidden patterns |
| Data Depth | Includes employee context | Focuses on quantifiable output |
Why Real-Time Matters
Consider this: A team’s productivity drops 23% in a single month. By the time you discover it in month-end reporting, three people have already left, two more are job hunting, and customer commitments are at risk.
Real-time feedback mechanisms enable swift managerial adjustments before small problems cascade into major ones. You respond to shifts when you can still influence the outcome.
Your people operations team can address workload issues, management conflicts, or disengagement signals while solutions still matter.
Connecting Feedback to Your Productivity Metrics
The gap most organisations fail to bridge is this: productivity metrics show what happened, but employee feedback shows why.
When you layer real-time feedback directly onto your productivity metrics, patterns emerge:
- Declining code quality scores: Real-time feedback reveals pressure from unrealistic deadlines and unclear requirements
- Rising customer service resolution times: Feedback shows staff morale dropped after a management change
- Project delays: Sentiment data shows teams feel unclear about priorities and lack autonomy
Without feedback context, you adjust timelines. With it, you fix actual problems.
How to Set This Up
Integration happens in three steps:
- Capture feedback where work happens: Meet employees in Slack, Teams, or your intranet—not in separate survey tools
- Link feedback themes to productivity KPIs: When sentiment shifts, trace it to specific metric movements
- Create feedback-driven action loops: Use insights to adjust workload, communication, or processes
Your technology company already captures productivity data. The question is whether you’re also capturing the cultural signals that explain why those numbers move.
Real-time feedback without productivity context is storytelling. Productivity metrics without feedback context are numbers without meaning. Together, they become strategy.
Reducing Bias Through Continuous Data
Monthly or quarterly feedback creates snapshot bias—people’s opinions on one day shape decisions for months. Continuous feedback smooths out these fluctuations and reveals genuine trends.
AI-powered analysis of ongoing feedback reduces human bias in how you interpret data. Patterns emerge from the data itself rather than manager interpretation or recency bias.
This combination—continuous feedback plus analytical rigour—produces more reliable insights and fairer assessment of actual performance.
Pro tip: Start by mapping one key productivity metric to feedback themes you already collect, then track how they move together over four weeks. This proof-of-concept will show you where real-time feedback creates actionable intelligence.
Linking Metrics to Retention and Revenue
Productivity metrics only matter if they connect to outcomes that affect your bottom line. Disconnected metrics become data exercises. But when you link productivity to retention and revenue, you create business justification for culture initiatives.
Your CFO cares about two things: keeping people and making money. Show how productivity connects to both.
The Retention-Productivity Link
Here’s what most people operations managers don’t realise: your best performers leave quietly. They don’t complain. They don’t perform poorly. One day they give notice, and you lose institutional knowledge, client relationships, and momentum.
High levels of employee well-being correspond to improved retention and revenue growth. When people feel valued and unsupported, they leave—usually for competitors who’ll value them better.
Productivity metrics reveal who’s at risk. When someone’s output drops suddenly, or engagement signals turn negative, that’s often your signal they’re already interviewing elsewhere.
Calculating Retention Impact on Revenue
Turning over a mid-level technology employee costs roughly 150 percent of their salary when you account for recruitment, onboarding, lost productivity, and knowledge transfer. One unexpected departure cascades.
When you measure productivity alongside retention risk, you can quantify the business case for intervention:
- Engineer departures: Lost revenue from project delays, knowledge gaps, and hiring costs
- Manager turnover: Entire teams destabilise when leaders leave; productivity crashes across the group
- Customer-facing staff: Direct impact on client retention and deal velocity
This is why an integrated framework connecting retention systems to productivity metrics matters. You stop treating retention as an HR metric and start treating it as a revenue metric.
Building the Business Case
Start here:
- Identify high-impact departures: Which roles, when lost, most damage revenue and operations?
- Track their productivity signals: Where did engagement or performance begin to decline?
- Calculate the cost: Salary replacement cost plus revenue impact from their absence
- Measure retention improvement: How much did real-time intervention save?
You’re not just reducing turnover. You’re protecting revenue streams and operational stability.
Every departure is a productivity collapse in disguise. Retention isn’t soft—it’s operational.
Connecting the Dots for Leadership
When you show leadership that a 5 percent improvement in retention saves £2 million annually, culture initiatives shift from “nice-to-have” to strategic priority.
Productivity metrics quantify culture’s business impact. They turn feedback insights into revenue protection.
Pro tip: Calculate the revenue impact of a single unexpected departure in your highest-impact roles, then work backwards to show what early intervention through real-time feedback could have prevented. This single scenario becomes your strongest business case.
Common Pitfalls and Ethical Considerations
Measuring productivity feels objective—numbers are numbers. But how you measure, what you measure, and how you use that data determines whether you build trust or destroy it. Get this wrong, and your best people leave.
There’s a difference between productivity intelligence and surveillance. Your team can feel the difference immediately.
The Measurement Trap
Many organisations measure what’s easy to track instead of what matters. Lines of code written. Emails sent. Time spent in meetings. Chat activity. Hours logged.
None of these equal productivity. Someone could write 500 lines of code and break the entire system. Another person contributes through mentoring, strategy, or knowledge-sharing—invisible in activity metrics.
Relying on outdated metrics focused solely on outputs may not capture modern work. The real problem: when you measure activity instead of outcomes, people optimise for the metric instead of the work.
They game the system. Morale collapses. Your best performers leave.
Quality Over Quantity Pressure
When productivity metrics reward volume, quality suffers. Your software team pushes code faster. Your customer service reps handle more calls. Your sales team books more meetings.
But code breaks. Customers hang up frustrated. Meetings lead nowhere. You’ve optimised for metrics at the cost of actual business results.
The solution isn’t removing metrics. It’s measuring what actually matters: sustainable output, customer impact, and long-term value creation.
Privacy, Bias, and Trust
Ethical considerations in productivity metrics encompass transparency about data collection and protecting employee privacy. When people don’t know they’re being tracked, or when tracking feels invasive, trust evaporates.
Also critical: bias in how you interpret data. Two employees produce identical output, but one is flagged as “underperforming” because they have a disability affecting how they work. Another is ignored because their manager likes them.
Without guardrails, productivity metrics amplify existing biases rather than remove them.
Building Ethical Measurement
Start with transparency and consent:
- Tell people what you measure: Explain metrics before implementation, not after
- Protect privacy: Minimise personal data collection; focus on work outputs
- Involve employees in design: Let teams help define what success looks like
- Prevent metric gaming: Measure outcomes, not activity; reward sustainable work
- Regular audits: Check whether metrics produce intended results or unintended consequences
When employees help design metrics, they stop feeling like surveillance and start feeling like clarity.
Productivity metrics without trust become tools of control. Metrics built with transparency become tools of empowerment.
The Psychological Safety Question
Even well-designed metrics can backfire in low-trust environments. People become defensive. They hide problems instead of solving them. Innovation stops.
You can’t measure your way to productivity. You have to build a culture where people feel safe being productive.
Pro tip: Before launching any productivity metric, ask your team: “Would you feel comfortable with your manager making decisions based solely on this data?” Their honest answer reveals whether your metric is fair. If they hesitate, redesign it.
Unlock Real-Time Employee Productivity Insights to Drive Your Business Forward
The article highlights a common challenge faced by many organisations: static, disconnected productivity metrics that fail to capture the real reasons behind performance changes. If your current approach leaves you struggling to understand why productivity drops or how culture impacts retention and revenue, you are not alone. Key pain points include the need for actionable, real-time data, integration of continuous employee sentiment, and linking cultural signals directly to business KPIs.
Wurkn is designed to close this gap by transforming continuous and anonymous employee feedback from tools like Slack and Microsoft Teams into clear, contextual cultural intelligence you can trust. Our platform minimises privacy concerns while helping leaders see what is happening in their culture and why, enabling early diagnosis and effective interventions before issues escalate.
Experience a new way to measure productivity that combines quantitative outcomes with the human voice. Explore how Wurkn’s cultural business intelligence platform connects employee engagement to productivity, retention, and revenue in real-time for PeopleOps and CXO teams looking for tangible impact.
Take the first step to move beyond outdated metrics and turn employee sentiment into a strategic advantage. Discover how Wurkn can empower your organisation to build healthier teams, reduce churn, and improve operational performance now by visiting https://wurkn.com.
Frequently Asked Questions
What are employee productivity metrics?
Employee productivity metrics track how effectively teams convert inputs like time and resources into outputs that drive business results.
Why are productivity metrics important for a business?
Productivity metrics provide insights into how well employees are performing, helping businesses understand the cultural and environmental factors that influence productivity. This understanding can lead to improved profitability and employee retention.
How can real-time feedback improve productivity metrics?
Real-time feedback allows organizations to detect and address productivity issues early, ensuring that managers can intervene before small problems escalate into larger ones. This proactive approach enhances overall performance and team morale.
What types of productivity metrics should I use for my team?
Effective organizations use a combination of time-based metrics, output metrics, quality metrics, and behavioral metrics that align with the specific needs and responsibilities of different roles within the team.